Geographical effects across England
How much of a school’s results depends on where it is, once Value Added v2.1 has allowed for its intake; which places stand out; and what we know about why.
ImportantIn short
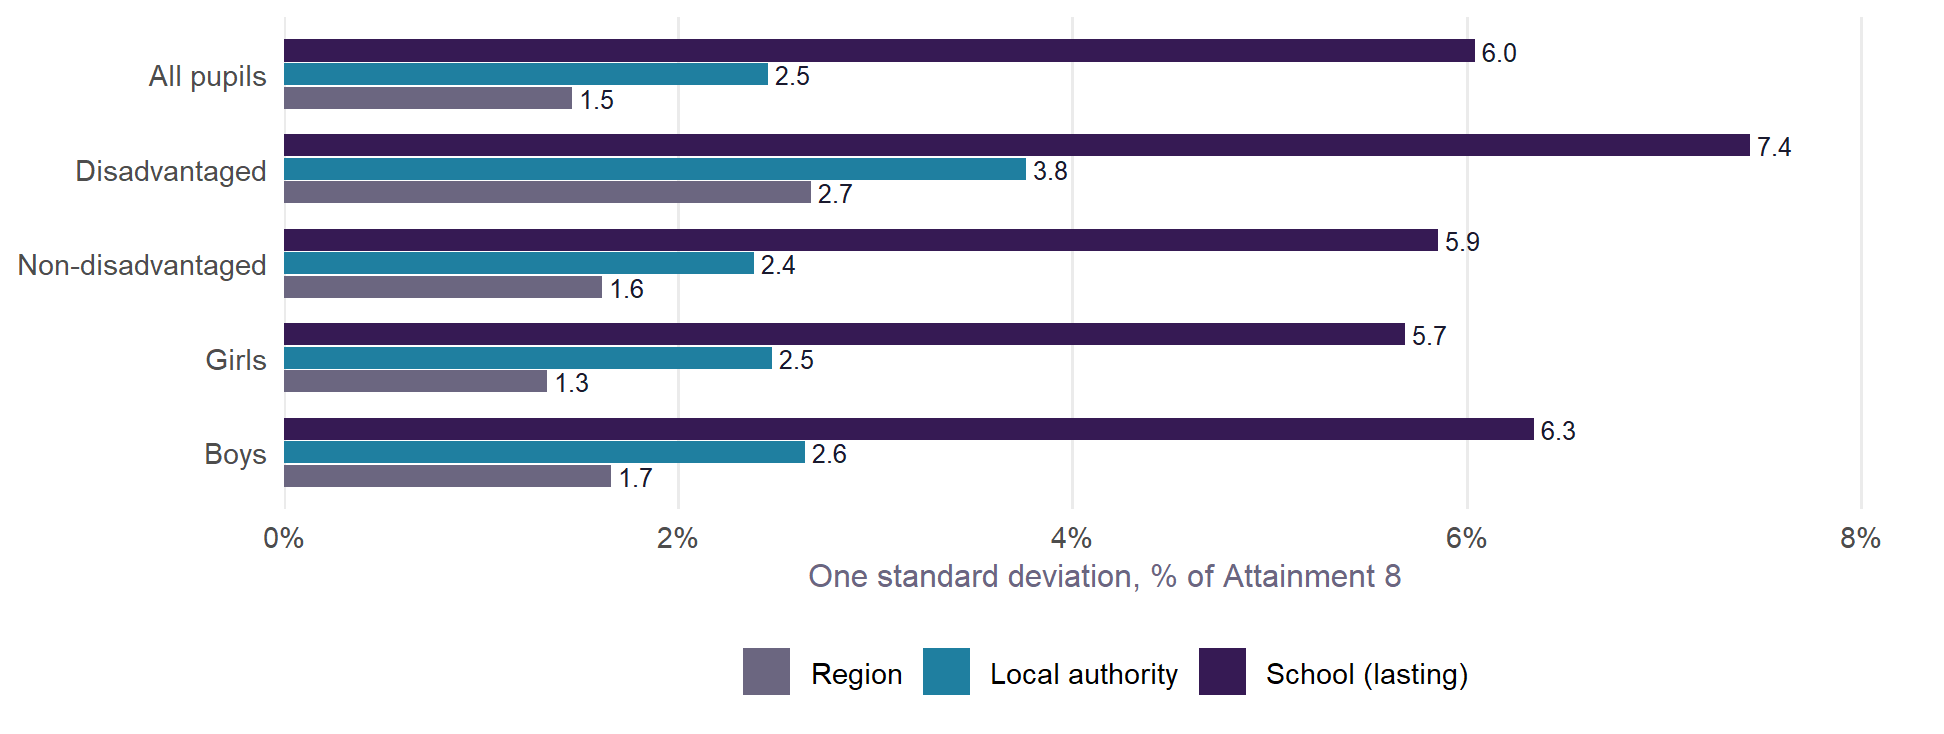
- Place matters, but less than the school. Once v2.1 has allowed for intake, a local authority one standard deviation above average adds about 2.5% to its schools’ Attainment 8, and a region about 1.5%. A school’s own lasting effect is about 6.0%.
- Place matters most for disadvantaged pupils. For them the authority effect is 3.8% and the region effect 2.7%, against 2.4% and 1.6% for non-disadvantaged pupils. Disadvantaged pupils in London do 5.1% better than similar pupils across England; in the South East, 4.1% worse. London’s non-disadvantaged pupils do 1.5% worse.
- What goes with it is partly the kind of place, partly the pupils. Disadvantaged pupils do better where schools serve multicultural, urban neighbourhoods. They do worse in small-town, coastal and former industrial areas (Neighbourhood types). Much of that is who the pupils are, since v2.1 has no pupil ethnicity. Some is deprivation that the qualification term misses (Neighbourhood covariates). Most of the authority effects remain unexplained.
How much is place?
Value Added v2.1 fits each school’s results with random effects for its region and its local authority. These pick up what places have in common once intake is allowed for. Their size, against each school’s own lasting effect:
Between the authorities a tenth of the way from the top and a tenth of the way from the bottom, the gap is about 5.7% of Attainment 8 for all pupils (about 2.7 points at the national average), 8.0% for disadvantaged pupils and 5.6% for non-disadvantaged pupils. That is the difference a place makes to otherwise similar schools.
This is why Value Added v2.1 is published two ways. Against England keeps the place in: a school in an authority where similar schools do well looks better. Within the authority takes it out, and compares a school with similar schools nearby.
The map
Each authority is coloured by its effect in Value Added v2.1: how far its schools’ results sit from what their intake predicts, as a percentage of Attainment 8, net of its region. Green is above what intake predicts (a positive effect); purple is below (a negative effect). Pale areas are close to zero. These are the same colours as the explorer. Hover over an authority for its figure, interval and rank.
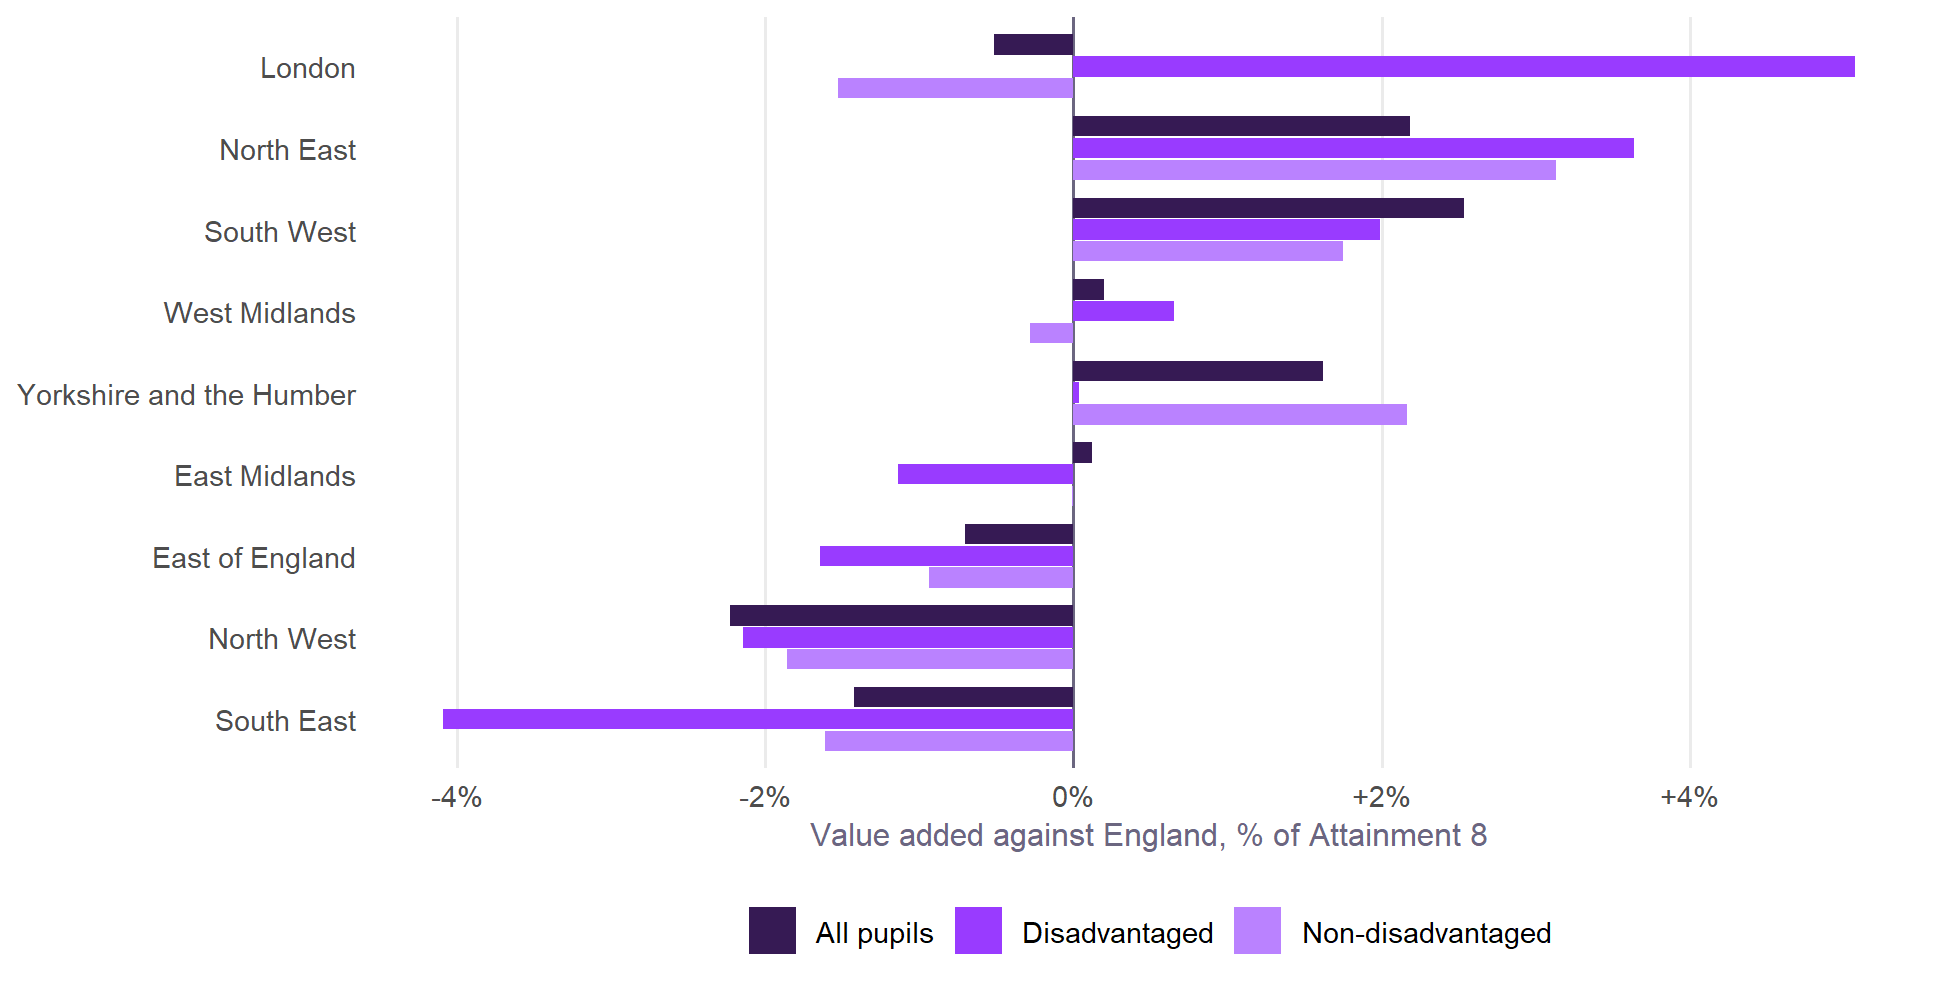
The regional pattern is different for disadvantaged pupils. For all pupils, the South West and North East do best, the North West worst. Non-disadvantaged pupils are similar, with the North East first. For disadvantaged pupils, London leads at +5.1%, and the South East is last at -4.1%. London’s lead belongs to its disadvantaged pupils alone: its non-disadvantaged pupils are at -1.5%. Brighton and Hove’s effect is among the largest in England: +3.8% for all pupils (6th of 152), +3.9% for disadvantaged pupils (18th of 151) and +3.8% for non-disadvantaged pupils (4th of 151). Its own page examines it.
What goes with place
What the evidence on this site says about why places differ:
- The kind of neighbourhood. The Output Area Classification adds nothing to results within an authority. Between authorities it describes the pattern for disadvantaged pupils. They do better where schools serve multicultural neighbourhoods: group 4c, Challenged Multicultural Communities, has a correlation of +0.34 with the authority effect. They do worse among the classification’s “Baseline UK” neighbourhoods (-0.28) and among small-town (-0.23) and coastal and former industrial ones (-0.20). This is the pattern behind London’s lead and the South East’s position for disadvantaged pupils. For non-disadvantaged pupils the same correlations are much weaker (4c +0.10, 6b -0.12).
- Not adult qualifications. v2.1 already allows for neighbourhood education, and the place pattern survives it. Two places with the same share of graduates can differ in diversity, migration and the character of their towns.
- Not absence, much. Absence is in the model, and authorities’ absence effects barely track their value added effects: no correlation reaches 0.2 for any of the three groups. For all pupils the largest link is with illness absence, +0.14: where pupils are recorded ill more often than intake predicts, value added is slightly higher. It is the same for disadvantaged pupils (+0.14) but not for non-disadvantaged pupils (+0.02). Brighton and Hove is the clearest case (see What goes with school absence).
- A worked example. Brighton and Hove tests the explanations one at a time for one authority.
- Who the pupils are, and deprivation the qualification term misses. The neighbourhood covariates experiment added ten Census measures, and each school’s own share of White British pupils, to the model. For disadvantaged pupils, the school’s composition and neighbourhood deprivation together take about a fifth off the authority effects and over a third off the regional ones. The ethnic pattern is mostly the pupils themselves, not the place. For all and non-disadvantaged pupils, authority effects move much less.
How far from school?
Where schools are is part of geography too. Across England, children in deprived neighbourhoods usually live closer to a secondary school. In Brighton and Hove they live about a third further away than their neighbours. Absence goes with distance in every year tested, more for disadvantaged pupils, though most of the size of that link between authorities is who lives where, and a smaller link remains. Distance to school sets out the tests, in straight lines.
What it means
- Read value added against England with the place in mind. Part of a school’s figure is where it is: up to a few per cent for all and non-disadvantaged pupils, more for disadvantaged pupils. The within-authority figure takes that out.
- Place effects are largest for the pupils policy most wants to help. A disadvantaged pupil’s results depend more on the authority and region than a non-disadvantaged pupil’s do, even with the same intake.
- Part of the place effect is the pupils. v2.1 has no measure of pupils’ ethnicity. The experiment suggests that is much of what makes disadvantaged pupils’ results look like a place effect. The rest of the authority effects are not in the Census at all.
Built by R/12_geography.R from the v2.1 model (R/02_fit_va.R), with boundaries from ONS (counties and unitary authorities, December 2023).