| Group | v2.1 effect | v2.1 rank | Without absence | Rank without absence |
|---|---|---|---|---|
| All pupils | +3.7% | 6 of 152 | +0.6% | 60 of 152 |
| Disadvantaged | +3.9% | 18 of 151 | -0.0% | 78 of 151 |
| Non-disadvantaged | +3.7% | 4 of 151 | +1.2% | 45 of 151 |
| Girls | +2.8% | 14 of 152 | -0.0% | 76 of 152 |
| Boys | +4.5% | 4 of 152 | +1.6% | 41 of 152 |
Geographical effects
Brighton and Hove: why the city’s schools sit so far above what Value Added v2.1 expects, what explains it, and what might.
NoteIn short
On the v2.1 model Brighton and Hove has the 6th largest local authority effect of 152: its schools’ Attainment 8 runs +3.7% above what intake and context predict, after neighbourhood education is taken into account. Almost all of it is an absence effect. The city’s absence is among the highest in England, the model expects that absence to cost attainment, and in Brighton and Hove it costs much less than expected. Take absence out of the model and the authority falls to 59th. The extra absence is mostly authorised illness. Why it costs so little here is the open question, and family-level resources are one of the likely answers.
How large, and how steady
The effect is there for every group of pupils and in every year:
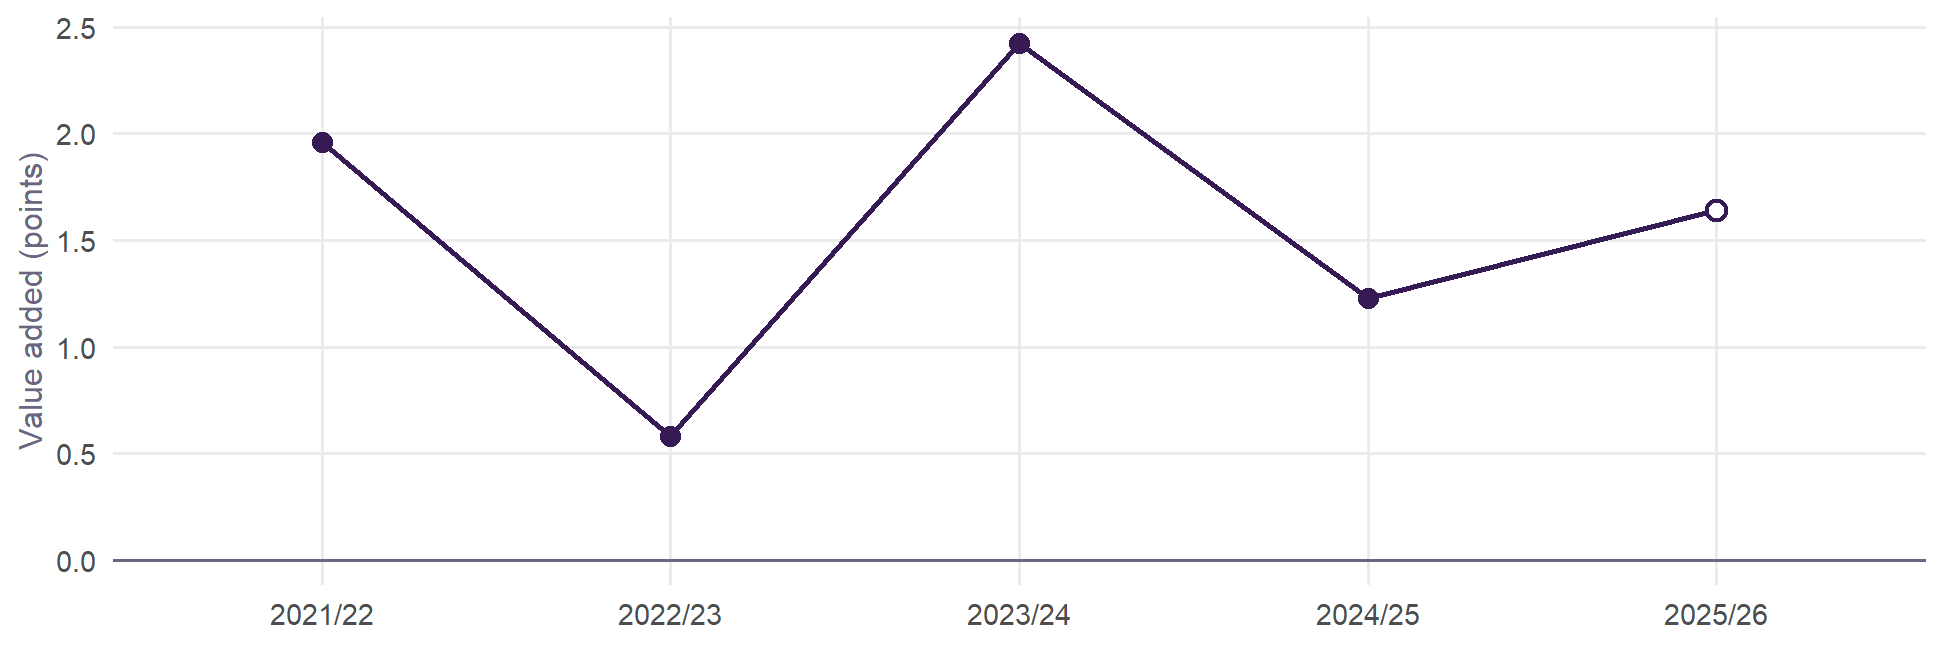
A school in Brighton and Hove averages +0.6 to +2.4 points a year above similar schools in England. That is not one good cohort.
It is an absence effect
The test is to refit the model one term at a time. Each row below is the all-pupils model with one change, on the 12,763 school-years that have published absence reasons:
| Model | Effect | Rank | AIC vs v2.1 | Correlation of effects |
|---|---|---|---|---|
| Value Added v2.1 | +3.7% | 6 of 152 | +0 | 1.00 |
| Without absence | +0.6% | 59 of 152 | +3973 | 0.82 |
| Without neighbourhood education | +5.5% | 4 of 152 | +502 | 0.91 |
| Without prior attainment (KS2) | +6.9% | 1 of 152 | +2641 | 0.79 |
| Plus the illness share of absence | +3.5% | 7 of 152 | -34 | 1.00 |
| Absence split: illness and the rest | +2.6% | 16 of 152 | +488 | 0.97 |
| Without the 11-16 flag (v2.0) | +3.8% | 4 of 152 | +33 | 1.00 |
| Plus local segregation (Gorard index) | +3.7% | 6 of 152 | +2 | 1.00 |
- Without absence the effect falls from +3.7% to +0.6%, indistinguishable from zero.
- Without neighbourhood education or without prior attainment it grows, to +5.5% and +6.9%. Both are already working: the city’s intakes are more advantaged on both, and the model credits that. See neighbourhood education below.
- Local segregation changes nothing. Brighton and Hove’s catchment admissions, with random allocation as a tie-break, keep its schools relatively mixed, but that does not explain the effect.
- The 11–16 flag, added in v2.1, takes a little off: without it, as in v2.0, the effect is +3.8%. 60% of Brighton and Hove’s school-years are at 11–16 schools, against 37% in England, and nationally 11–16 schools score +1.0% higher.
The arithmetic. Over 2021/22 to 2024/25, the four years the model is fitted on, Brighton and Hove’s schools average 10.9% full-year absence against 9.0% for England (means of school-years), 6th highest of 152 authorities. In 2024/25 alone, the year the area page’s add-and-take figure uses, it was 11.3% against 8.6% (means of schools): the gap has widened. On the v2.1 absence coefficient (-0.225, an elasticity), that difference lowers expected Attainment 8 by 4.5%. The authority effect, +3.7%, almost exactly gives it back. Brighton and Hove’s schools attain about what similar intakes attain elsewhere. They do it despite absence that, elsewhere, goes with lower results.
Inside the city, absence costs about what it costs elsewhere. A school with more absence than its neighbours does worse by about the national rate: the interaction is +0.034 (standard error 0.042). It is the city’s level of absence that carries no penalty, not its slope.
What kind of absence
| Measure | Brighton and Hove | England | Difference |
|---|---|---|---|
| All absence | 10.9 | 9.0 | +1.9 |
| Illness (authorised) | 5.7 | 4.3 | +1.4 |
| Unauthorised | 3.2 | 3.0 | +0.3 |
| Other authorised | 1.5 | 1.3 | +0.2 |
| Illness share of absence | 57.3 | 52.5 | +4.9 |
Of Brighton and Hove’s 1.9 points of extra absence, 1.4 is authorised illness. Unauthorised absence is close to England’s. Illness makes up 57% of absence in the city (36th highest share of 152).
Nationally, illness absence costs less than other absence. Split in two, a 1% rise in illness absence goes with -0.06% Attainment 8 and a 1% rise in other absence with -0.12%. Allowing for that takes some of the effect away: to +3.5% with the illness share, +2.6% with absence split. It does not take most of it away. Absence’s type, as DfE records it, is part of the story, not the whole of it.
Neighbourhood education
v2.1 measures neighbourhood education as the share of adults with a degree-level (level 4+) qualification in the 150 Census output areas nearest each school, from the 2021 Census. It is there because a school’s results follow the education of the families around it, and FSM sees only the bottom of that.
Where the city’s schools sit. Their neighbourhoods average 43.4% of adults at level 4+, against 33.2% around England’s schools: about 1.0 standard deviation higher, 25th of 152 authorities. The share with no qualifications is 13.9% against 18.8%. 9 of the city’s 10 schools sit above England’s median school:
| School | Level 4+, 150 nearest | Level 4+, 10 nearest | No qualifications, 150 nearest | Percentile in England |
|---|---|---|---|---|
| Cardinal Newman Catholic School | 57.2% | 58.9% | 8.8% | 97 |
| Dorothy Stringer School | 50.5% | 59.0% | 10.4% | 93 |
| Hove Park School and Sixth Form Centre | 48.3% | 52.4% | 12.9% | 91 |
| Varndean School | 48.1% | 51.9% | 11.1% | 91 |
| Patcham High School | 46.3% | 38.0% | 11.8% | 89 |
| Blatchington Mill School | 45.3% | 46.0% | 14.0% | 87 |
| King's School | 39.8% | 25.8% | 15.1% | 78 |
| Longhill High School | 36.9% | 42.0% | 18.3% | 71 |
| Brighton Aldridge Community Academy | 31.9% | 19.1% | 17.2% | 53 |
| Portslade Aldridge Community Academy | 29.3% | 22.3% | 19.1% | 42 |
What the model already credits. Each standard deviation of neighbourhood education is worth +2.44% of Attainment 8 for all pupils, +2.58% for non-disadvantaged pupils and only +0.82% for disadvantaged ones. Set against England, the city’s neighbourhoods lift its schools’ expected Attainment 8 by about +1.1 points for all pupils, +1.3 for non-disadvantaged and +0.3 for disadvantaged pupils. That is credit the schools do not get: it is in the expectation, not in their value added.
Without the term, the authority effect would be +5.5% (3rd) rather than +3.7%. Neighbourhood education already accounts for about 32% of what would otherwise look like a city effect.
Would a better measure take more? The table refits the model with the neighbourhood drawn at every scale the original project built, and with the share of adults with no qualifications:
| Measure | Effect | Rank | AIC vs v2.1 |
|---|---|---|---|
| Level 4+, 150 nearest output areas (v2.0) | +3.7% | 6 of 152 | +0 |
| Level 4+, 100 nearest | +4.0% | 5 of 152 | +15 |
| Level 4+, 50 nearest | +4.2% | 6 of 152 | +59 |
| Level 4+, 25 nearest | +4.4% | 5 of 152 | +132 |
| Level 4+, 10 nearest | +4.5% | 4 of 152 | +200 |
| Level 4+, 5 nearest | +4.7% | 4 of 152 | +231 |
| Level 4+, distance-weighted over 50 | +4.2% | 7 of 152 | +82 |
| No qualifications, 150 nearest, in its place | +4.6% | 6 of 152 | +200 |
| Level 4+ and no qualifications, 150 nearest | +3.6% | 5 of 152 | -17 |
| No neighbourhood term | +5.5% | 3 of 152 | +484 |
No. A more local neighbourhood fits worse at every step, and leaves the city’s effect larger: +4.7% with the 5 nearest output areas. The no-qualifications share fits worse than level 4+. The best fit, level 4+ and no qualifications, 150 nearest, moves the effect only to +3.6%. Neighbourhood education is doing what it can, and the rest is not a neighbourhood the Census can see.
What it cannot see. The measure counts every adult, not parents. Brighton and Hove has two universities: students, whose highest qualification while studying is usually level 3, and young graduates without school-age children both sit in the count, in opposite directions, and neither says much about the families whose children attend the schools. A measure of parents’ qualifications, from the Census tables for households with dependent children, would test this directly (reading 1 below).
Would different admissions change it?
Because neighbourhood education matters, it is tempting to argue that admissions should open schools in well-educated neighbourhoods to children from elsewhere, so that more disadvantaged pupils share in it. The published data do not support that argument.
The term measures families, not the place. It sits on top of each school’s own prior attainment and disadvantage, so it is not the brighter children a school admits. It fits best at about the scale of a secondary catchment, and it is weaker for faith schools, which recruit less by distance (the review). It describes the families around a school, who are, under catchment admissions, the families whose children attend it. Admitting children from elsewhere changes who the pupils are, not what the school does for them.
It is worth little to disadvantaged pupils. A standard deviation of neighbourhood education is worth +0.8% of Attainment 8 for disadvantaged pupils, about 0.3 points, against +2.6% (about 1.3 points) for non-disadvantaged pupils.
Schools in more educated neighbourhoods have wider gaps, not narrower. Outside London, the gap between non-disadvantaged and disadvantaged pupils’ Attainment 8 rises from 10.9 points in the least educated fifth of neighbourhoods to 14.9 in the most. Holding prior attainment, disadvantage and absence fixed, each standard deviation of neighbourhood education widens it by 1.0 points (t = 11).
Disadvantaged pupils’ value added does not rise with the school’s neighbourhood. Across England the two correlate at 0.12, but that is London, which makes up 49% of the most educated fifth of neighbourhoods and where disadvantaged pupils do unusually well. Outside London the correlation is -0.05, and within local authorities -0.02.
Nor do disadvantaged pupils do better among fewer disadvantaged peers. Given their prior attainment, they do slightly better where more of their schoolmates are disadvantaged: the disadvantage term in their model has an elasticity of +0.027 (t = 7.0).
And Brighton and Hove already runs catchments with random allocation. Its schools are relatively mixed, and adding local segregation to the model changes the authority’s effect not at all (+3.7% against +3.7%).
In one line: neighbourhood education measures the families a school serves, not something the building confers; outside London, disadvantaged pupils at schools in educated neighbourhoods add no more value and face wider gaps. Two cautions. This is school-level evidence, which can show what schools look like but cannot isolate what one pupil would gain by moving, so it does not settle questions of peer effects. And the disadvantaged pupils who attend schools in advantaged neighbourhoods now need not be like those who would under different rules.
So what is it?
The data are school-level, so they cannot settle this. Four readings fit what is above, and they are not exclusive.
- Family resources that keep learning going. A day off costs less when someone at home can help catch up: parents with degrees, flexible or home-based work, tutoring, books. FSM does not see this, and neither, quite, does neighbourhood education, which already takes about 32% of the effect and can take no more however it is drawn (above). It counts every adult, not parents. The effect is largest for boys and non-disadvantaged pupils (3rd of 151–152 for both). It is also present for disadvantaged pupils (16th), which fits a city with many lower-income households that are highly educated.
- Absence as a stand-in. Across England, high absence travels with things the model does not measure: family stress, poverty beyond FSM, disengagement. Part of the absence coefficient is those things, not the days missed. Where absence comes from somewhere else, the model over-predicts its cost. In Brighton and Hove it is mostly authorised illness, which may include anxiety and other health-related absence that follows a different pattern from disengagement. On this reading the authority effect is partly an artefact of how v2.1 treats absence, not something the schools do.
- Recording. Schools and authorities differ in when they authorise illness and how they code it. A practice that authorises more parent-reported illness raises recorded absence without changing learning. This would show up as exactly this pattern, and school-level data cannot tell it from reading 2.
- Something the schools or the system do. The 11–16 structure, where entry to the city’s sixth-form colleges depends on GCSE grades, explains a little. Mixed intakes explain nothing measurable. Whatever is left after absence (+0.6%, ranked 59th) is ordinary.
What would help tell them apart
All of these are published:
- Absence by pupil characteristics, by authority (DfE, Pupil absence in schools in England). Is the city’s extra absence among pupils eligible for free school meals or not, and in which year groups? Reading 1 predicts it is mostly among the non-disadvantaged.
- Census 2021 qualifications for parents rather than all adults: households with dependent children by the household reference person’s qualification or NS-SeC, for school neighbourhoods. This would test reading 1 directly, and would improve v2.1’s neighbourhood term everywhere students and young graduates are concentrated.
- Persistent absence and absence reasons by authority over time, against attainment. Reading 3 predicts the city’s illness authorisation sits apart from its neighbours’ with no matching change in attainment.
- Elective home education and children missing education (DfE, by authority). These show whether pupils leave school rolls before Year 11 at unusual rates, which would change who sits GCSEs.
- Attainment by prior-attainment band in the KS4 performance tables: whether the effect sits with high, middle or low prior attainers.
What it means for v2.1
v2.1 took the 11–16 flag into the expectation: it is a school’s structure, like its admissions policy. It treats a day of absence the same whatever its cause. Adding the illness share of absence improves the fit (AIC -34) and barely changes other authorities’ effects (correlation 0.997), but whether an absence is authorised as illness is partly the school’s own coding, so it stays out of the headline. Value added allowing for the kind of absence is published beside it instead (the methodology). Neither removes Brighton and Hove’s effect. Until the questions above are answered, read the city’s authority effect this way: its schools achieve as much as similar schools elsewhere despite unusually high, mostly illness, absence. It is not evidence that the city’s schools add more than others. With no allowance for absence, the city’s schools average -0.7 points of value added, 102nd of 151 authorities.
The models are in R/06_bh_effect.R.