Overview
School attainment matters and Policy Makers understandably want to improve it for all children to give them the best change of future success. But it is all to easy to pull the wrong policy lever when information and intelligence is incomplete. Recent experiences in Brighton and Hove have highlighted the gap between open data and actionable intelligence for Policy Makers, Schools and anyone wanting to actively contribute to statutory public consultations. Intelligence to inform local debates could be available from within freely available online data sources, but is largely hidden within mountains of data and a vast specialist literature.
Education professionals and researchers know what factors influence attainment and they know which are most important. But every school and every Local Education Authority is different and there is a gulf between general understanding and specific local intelligence that can target the most effective policy treatment for a particular location.
The How to Pull the Right Lever report desribes what can happen when good policy intentions can be derailed by an incomplete understanding, but shows how better understanding and better policy is within the grasp of any local education authority through the open data resources published by the Department for Education.
The Policy Simulator within this site is a first attempt bridge the open data -> actionable intelligence gap for local education policy in England. It has been designed to curate, process, visualise and analyse the extensive open data sources publised by the Department for Education in an accessible way. It allows users to explore what policy changes might have be biggest impact on school-level GCSE attainment for any state school in England, taking account of their own unique circumstances.
The simulator is underpinned by a robust statistical analysis of four years of DfE data detailed in the main report and supplementary materials found at the bottom of this page. The tool allows anyone to select a particular local authority or school and understand what the main attainment drivers for that place and thus what the most effective improvement policies might be.
Brighton and Hove is used as an illustrative case study example, the the tool and analysis are relevant for any Local Education Authority in England.
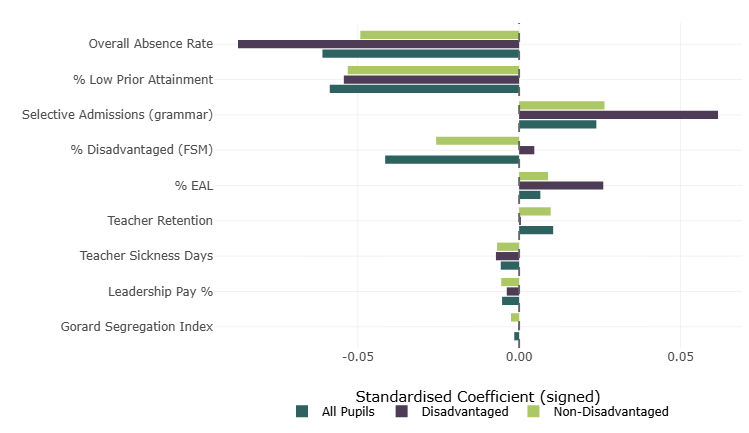
Key figures
If policy makers fail to take account of all relevant factors influencing attainment and particular local contexts and variations, they risk pulling the wrong lever. We hope the tool and analysis in these pages will help local authorities and schools make better decisions to improve educational outcomes for all children.
Analysis reports & data
Detailed technical reports underpinning the main paper.