Each school coloured by Value Added v2.1 for all pupils; choose another measure, including absence against intake, from the menu. Circle size is the school’s roll; hover for every group’s value added, absence against intake, the published v1 figure, and Ofsted.
Crawley
Value Added v2.1 for the secondary schools of Crawley, West Sussex.
NoteAbout this page
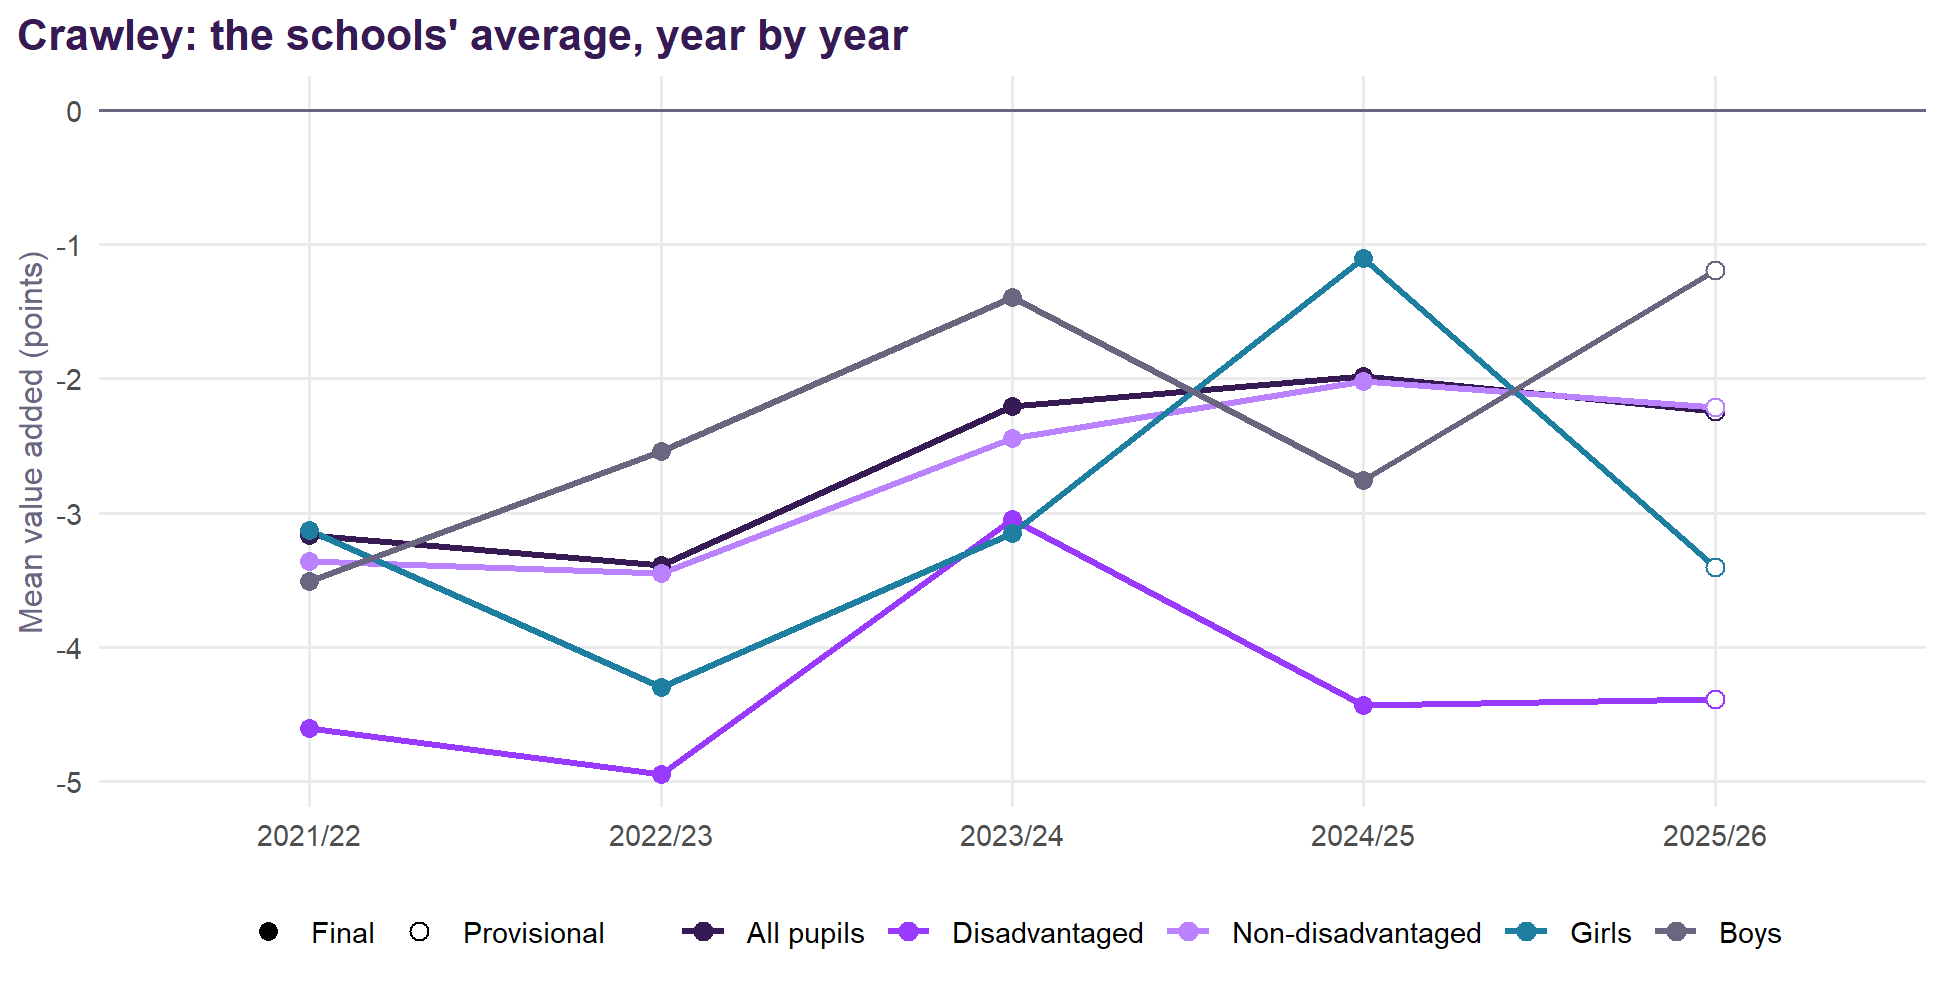
Value Added v2.1 for Crawley’s state-funded secondary schools, 2021/22 to 2024/25, measured against England (see the method), with the analyses of the original Sussex document refitted on the v2.1 model. Built from published DfE and Ofsted data; nothing uses pupil-level records.
Summary
- 7 schools, with value added for all pupils averaging -2.3 points against England: none significantly above expectation and 4 below.
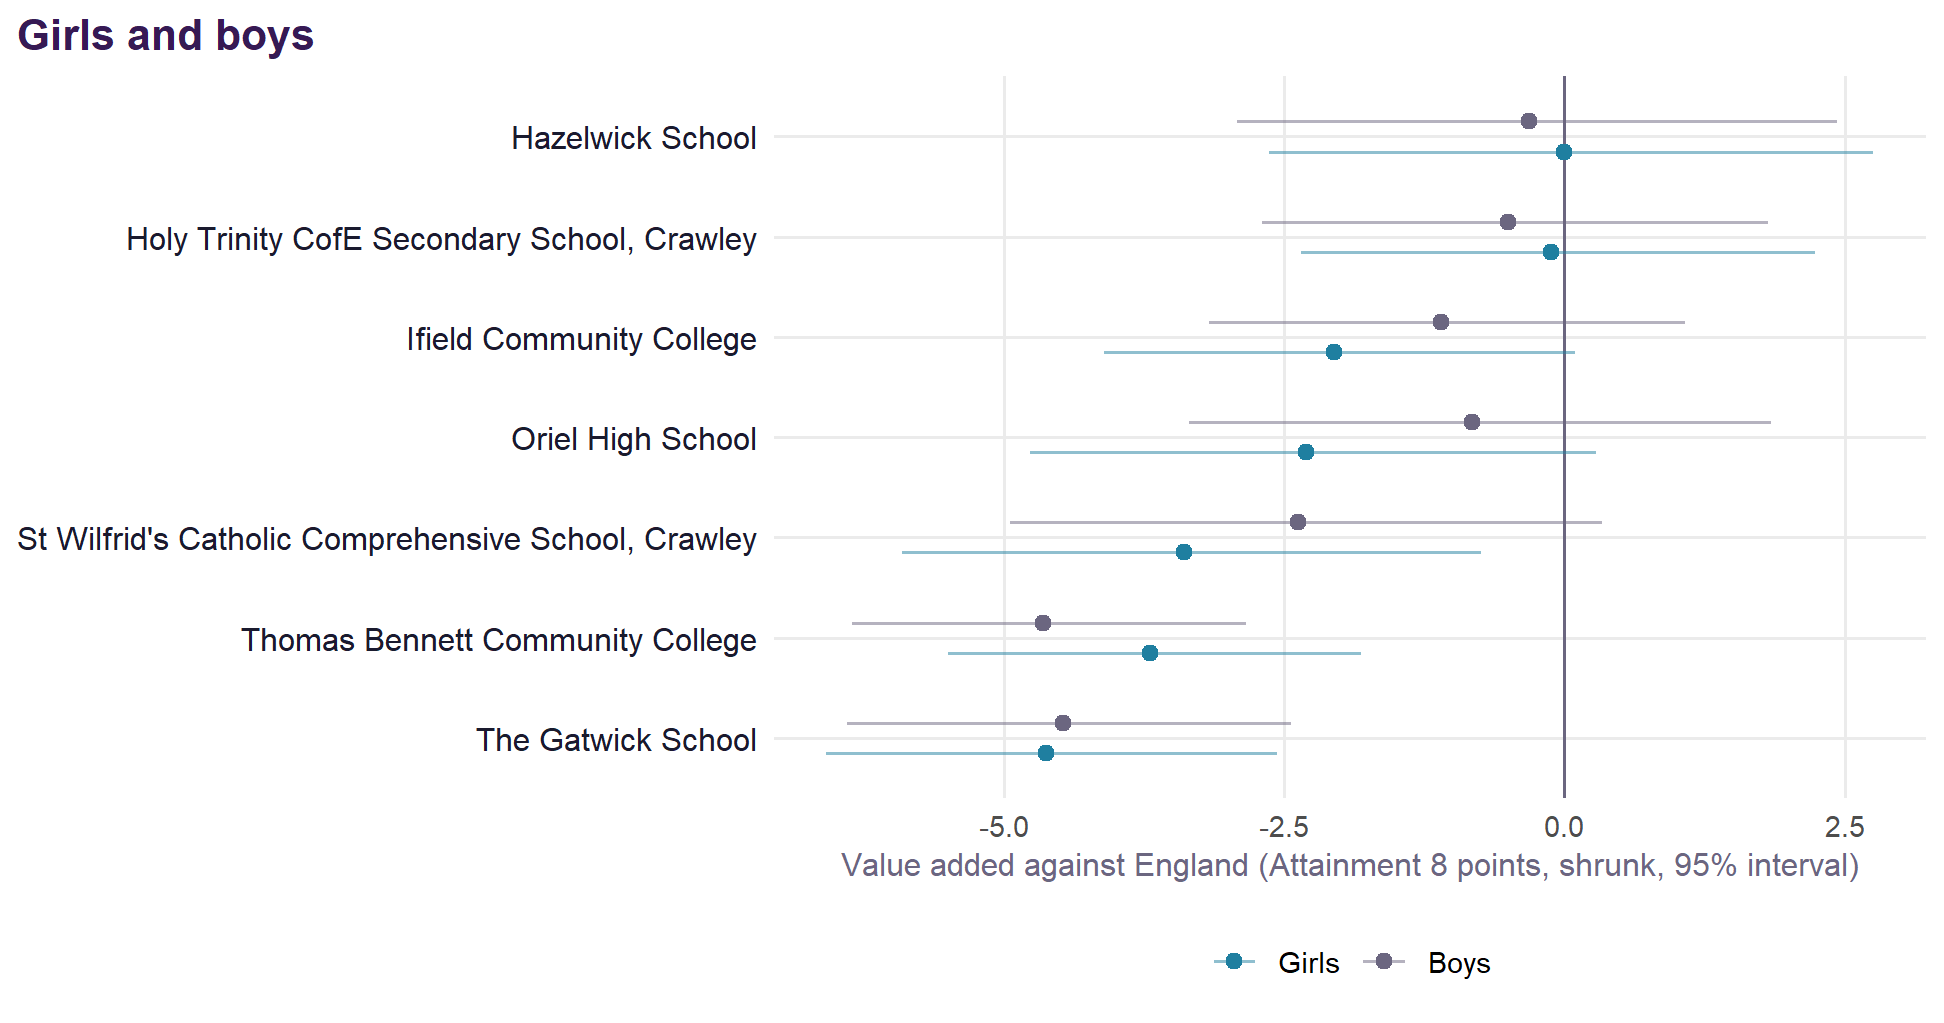
- Disadvantaged pupils -3.2, non-disadvantaged -2.4; girls -2.3, boys -2.0.
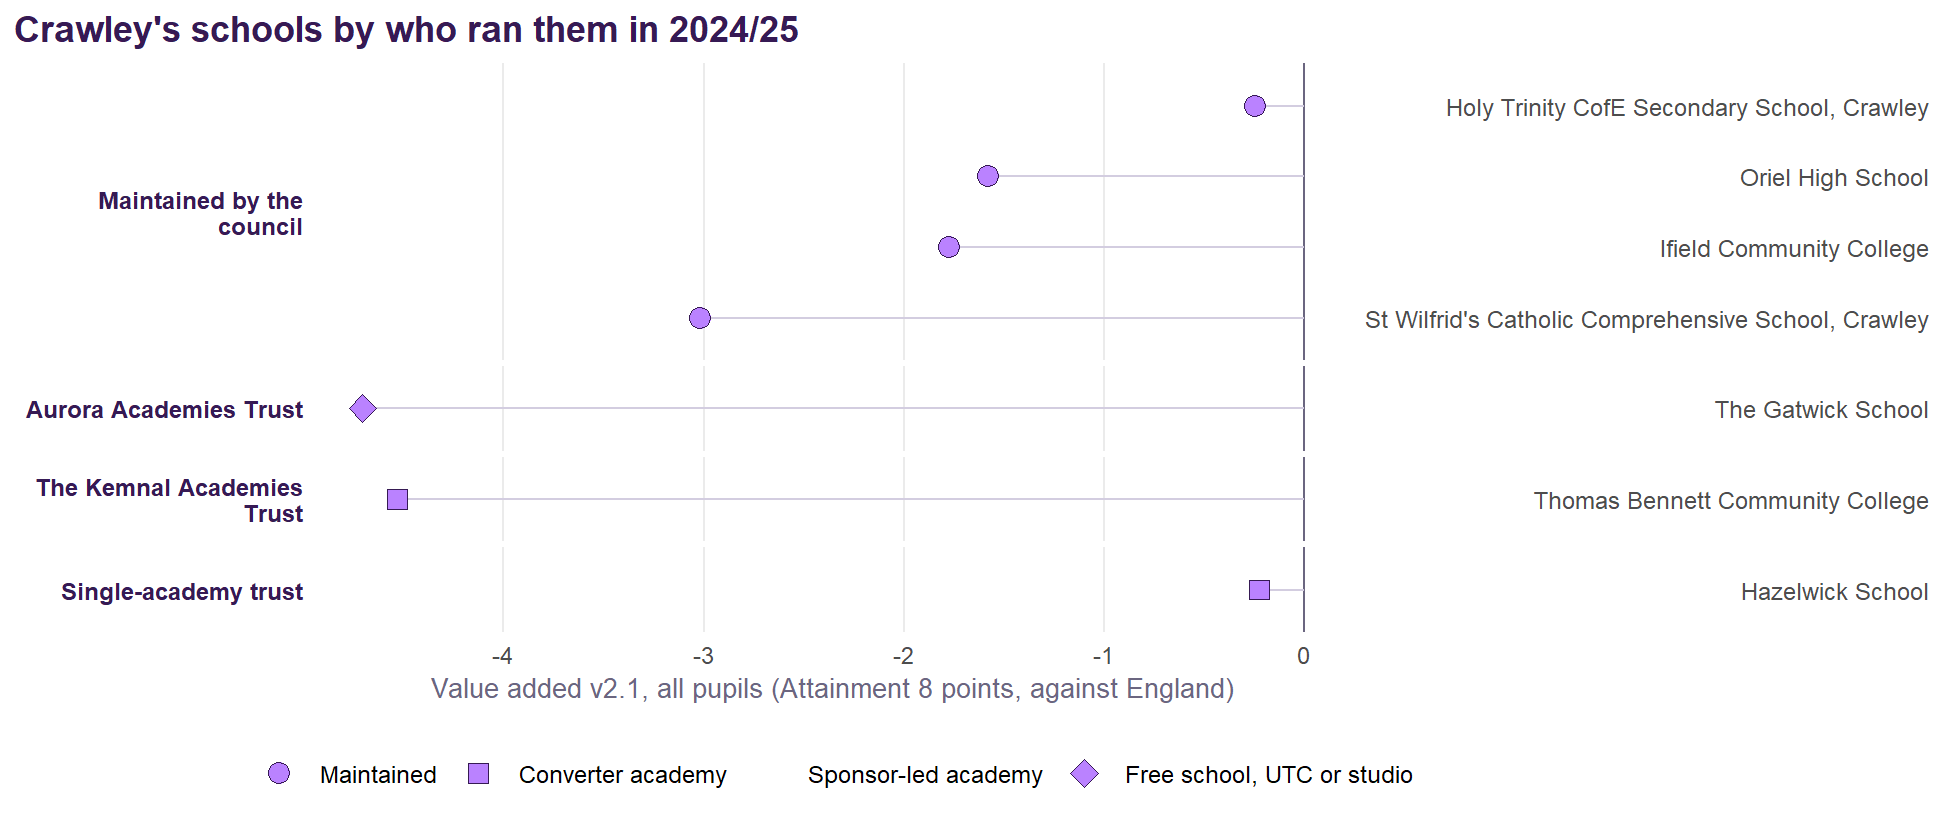
- Strongest: Hazelwick School (-0.2). Weakest: The Gatwick School (-4.7).
- Absence runs 0.4 points below what the intake predicts on average over 2021/22 to 2024/25; Holy Trinity CofE Secondary School, Crawley more than a point above.
- 0 of 7 schools add value with attendance at or better than their intake predicts; 0 add value despite worse attendance, and 2 are below expectation with worse attendance (value added and attendance).
- District effects on the v2.1 model (Crawley for all pupils (-4.2%), Crawley for disadvantaged pupils (-4.7%) and Crawley for non-disadvantaged pupils (-3.9%)) disappear once each school’s own record is counted: they belong to schools, not places.
- Suspensions: 18.5 episodes per 100 pupils (England 21.2); 7.0 pupils per 100 suspended at least once (England 7.3). Reduced timetables run at 2.1 times the national rate.
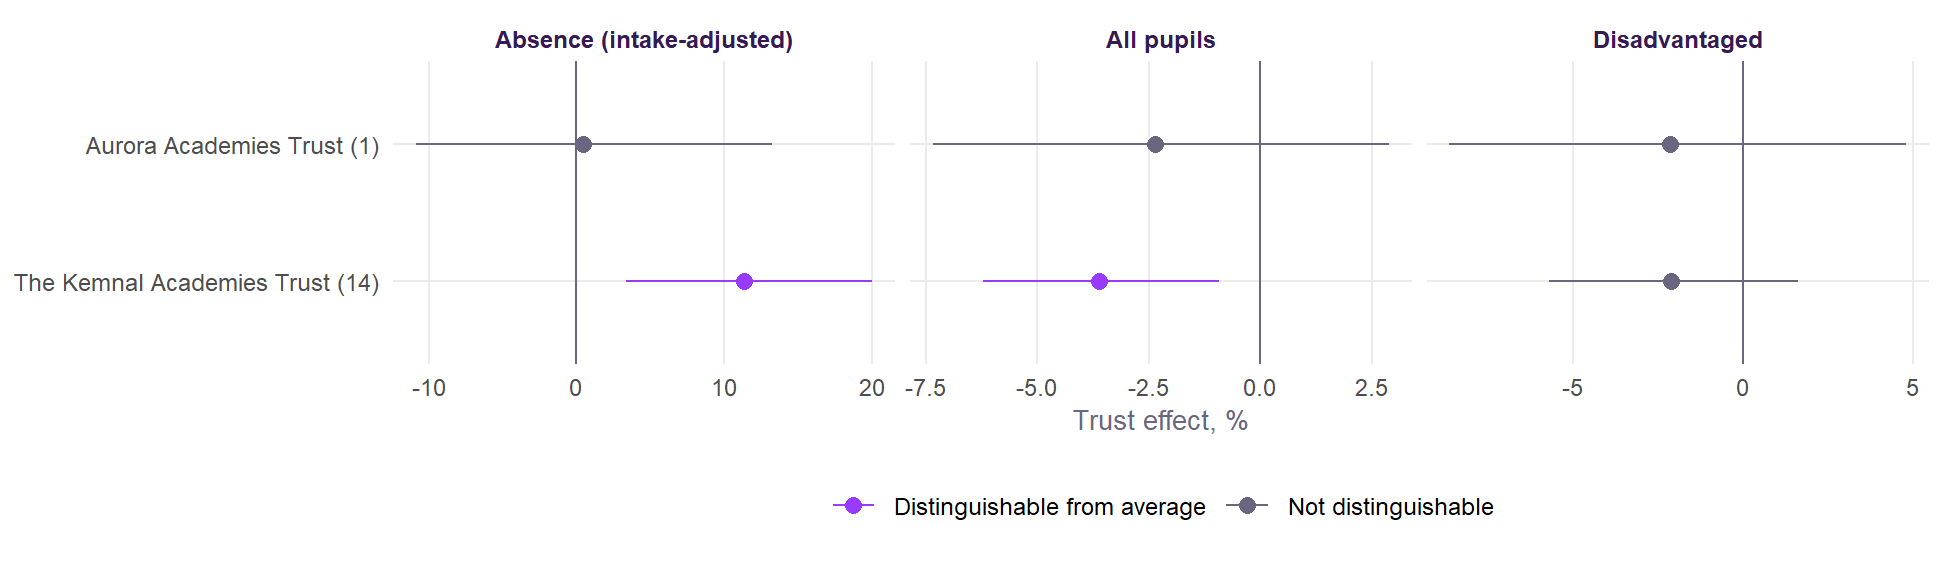
- Trusts that stand out nationally on v2.1: The Kemnal Academies Trust (all pupils -3.6% and absence +11.4%).
- Latest Ofsted: 1 inspection with no overall grade, 4 graded inspections and 2 ungraded visits only.
- 2025/26, provisional: value added for all pupils averages -2.2 points across the area’s schools on DfE’s provisional results. This will be updated with the revised release in February 2027.
The schools
| School | District | All pupils | Disadv. | Non-disadv. | Girls | Boys | Absence vs intake | 2025/26 (provisional) | v1 | Ofsted latest | Run by (2024/25) |
|---|---|---|---|---|---|---|---|---|---|---|---|
| Hazelwick School | Crawley | -0.2 (-2.3 to +2.0) | -2.0 | +0.1 | -0.0 | -0.3 | -1.7 | -4.0 | -1.5 | Outstanding (Oct 2023) | Single-academy trust |
| Holy Trinity CofE Secondary School, Crawley | Crawley | -0.2 (-2.0 to +1.6) | -1.7 | -0.5 | -0.1 | -0.5 | +1.3 | -1.4 | -1.1 | Good (Nov 2023) | Maintained by the council |
| Oriel High School | Crawley | -1.6 (-3.6 to +0.5) | -3.3 | -1.6 | -2.3 | -0.8 | -0.5 | -2.0 | -1.9 | No overall grade (Mar 2025): quality of education Good | Maintained by the council |
| Ifield Community College | Crawley | -1.8 (-3.4 to -0.1) | -1.2 | -2.5 | -2.1 | -1.1 | -0.5 | -2.2 | Remains Good (Apr 2023, ungraded visit) | Maintained by the council | |
| St Wilfrid's Catholic Comprehensive School, Crawley | Crawley | -3.0 (-5.1 to -0.9) | -5.9 | -2.5 | -3.4 | -2.4 | -1.2 | -5.0 | -4.0 | Remains Good (Mar 2023, ungraded visit) | Maintained by the council |
| Thomas Bennett Community College | Crawley | -4.5 (-5.9 to -3.1) | -4.0 | -4.4 | -3.7 | -4.6 | +0.3 | -3.1 | -6.0 | Good (Oct 2022) | The Kemnal Academies Trust |
| The Gatwick School | Crawley | -4.7 (-6.3 to -3.1) | -4.1 | -5.3 | -4.6 | -4.5 | -0.7 | +2.2 | -4.6 | Good (May 2024) | Aurora Academies Trust |
Who runs them
Value added and attendance
Two questions, kept apart. Does the school add value? Value Added v2.1 answers that with absence allowed for: a school with more absence is expected to score lower, so it is judged on what it achieves given its attendance. Does it hold attendance? Absence against intake answers that: how far its absence runs above or below what pupils like its own would predict. The chart sets one against the other. Neither contains the other, so the four corners mean what they say.
Of 7 schools, 0 add value with attendance at or better than their intake predicts, and 0 add value despite worse attendance. 2 are below expectation with worse attendance, and 5 are below expectation despite attendance at or better than predicted. Across England the two are close to independent (correlation -0.07; 0.04 across Crawley’s schools). Adding value and holding attendance are different things, and plenty of schools do one without the other.
Value added with no allowance for absence. The map also offers value added from the model without its absence term. It does not excuse a school its absence: for every percentage point its absence runs above what its intake predicts, it loses about 1.1 Attainment 8 points against Value Added v2.1. It is the two axes above folded into one number, so it belongs on the map, not on this chart, where it would contain the absence it is plotted against.
See the methodology.
Value added allowing for the kind of absence. The map also offers value added with the illness share of absence in the expectation: where more of a school’s absence is illness, the same absence is expected to cost less. It is published beside Value Added v2.1, not in it, because what is authorised as illness is partly the school’s own coding (methodology). Across Crawley’s schools the two agree at 1.00; no school moves by as much as half a point.
| School | District | Value added v2.1 | Absence vs intake | No allowance for absence | Run by (2024/25) |
|---|---|---|---|---|---|
| Furthest above | |||||
| Hazelwick School | Crawley | -0.2 | -1.7 | +1.5 | Single-academy trust |
| Holy Trinity CofE Secondary School, Crawley | Crawley | -0.2 | +1.3 | -2.3 | Maintained by the council |
| Oriel High School | Crawley | -1.6 | -0.5 | -2.1 | Maintained by the council |
| Furthest below | |||||
| St Wilfrid's Catholic Comprehensive School, Crawley | Crawley | -3.0 | -1.2 | -2.3 | Maintained by the council |
| Thomas Bennett Community College | Crawley | -4.5 | +0.3 | -5.8 | The Kemnal Academies Trust |
| The Gatwick School | Crawley | -4.7 | -0.7 | -5.2 | Aurora Academies Trust |
What Crawley’s schools add, and what absence takes away
Value added already counts absence as part of a school’s context, so what absence moves and what the school moves are separate quantities rather than one counted twice. Below, the blue bar is what this area’s absence is worth against the England average of 8.6% in 2024/25, run through the national gradient; the purple bar is the area’s mean value added, which is measured against England already. The diamond is the two together. Absence here is full-year absence in 2024/25, the mean of schools; value added covers 2021/22 to 2024/25. How the bars are computed from the model is set out in the methodology.
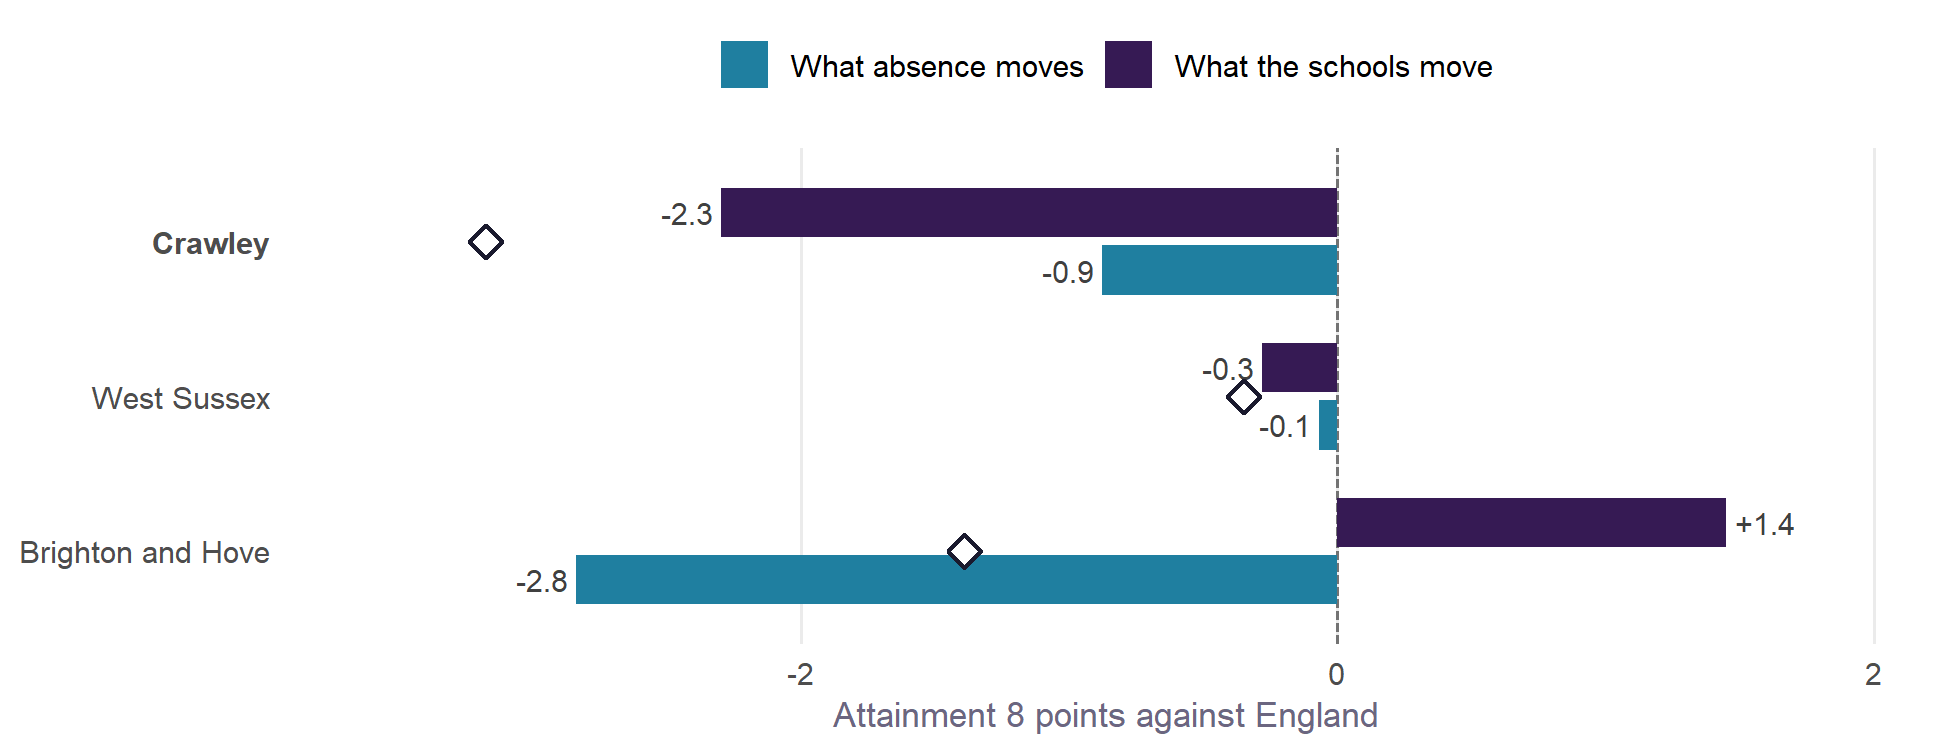
Crawley’s schools ran at 9.3% absence in 2024/25 against England’s 8.6%, which on the national gradient is worth -0.9 Attainment 8 points. Their mean value added is -2.3, so the two together leave the area -3.2 points against England. Both are pulling the same way, downwards.
For disadvantaged pupils the same absence is worth -1.0 points of their Attainment 8 (mean 38.4), against -0.7 for non-disadvantaged pupils (mean 50.3) and -0.9 for pupils as a whole (47.5): the gradient is 77% steeper for them than for non-disadvantaged pupils, so wherever attendance is the problem it is a sharper problem for the pupils with least room to absorb it.
The gradient is associational. It says what schools with this much absence look like once intake is accounted for, not what this area would gain by changing it.
How Crawley compares
| Measure | Crawley | West Sussex | Brighton and Hove | England |
|---|---|---|---|---|
| Attainment 8, all pupils | 42.1 (235th) | 46.4 | 45.5 | 46.8 |
| Attainment 8, disadvantaged | 30.7 (255th) | 33.5 | 33.9 | 37.7 |
| Attainment 8, non-disadvantaged | 45.3 (240th) | 48.9 | 49.6 | 49.9 |
| Disadvantage gap (points) | 14.6 (69th) | 15.4 | 15.7 | 12.2 |
| Disadvantaged (FSM6) % | 23.4 (154th) | 17.1 | 28.8 | 28.4 |
| Overall absence % | 9.3 (73rd) | 8.7 | 11.3 | 8.6 |
| Persistent absence % | 26.3 (55th) | 23.9 | 30.6 | 23.9 |
| Mean KS2 (centred) | 3.81 (188th) | 4.26 | 4.71 | 4.47 |
| EAL % | 26.2 (51st) | 11.0 | 13.0 | 18.4 |
| Value added v2.1, all pupils | -2.3 | -0.3 | +1.4 | 0.0 |
| Value added v2.1, disadvantaged | -3.2 | -1.7 | +0.4 | 0.0 |
| Value added v2.1, non-disadvantaged | -2.4 | -0.4 | +1.5 | 0.0 |
| Absence against intake (pp) | -0.4 | -0.3 | +1.7 | 0.0 |
What explains attainment in Crawley
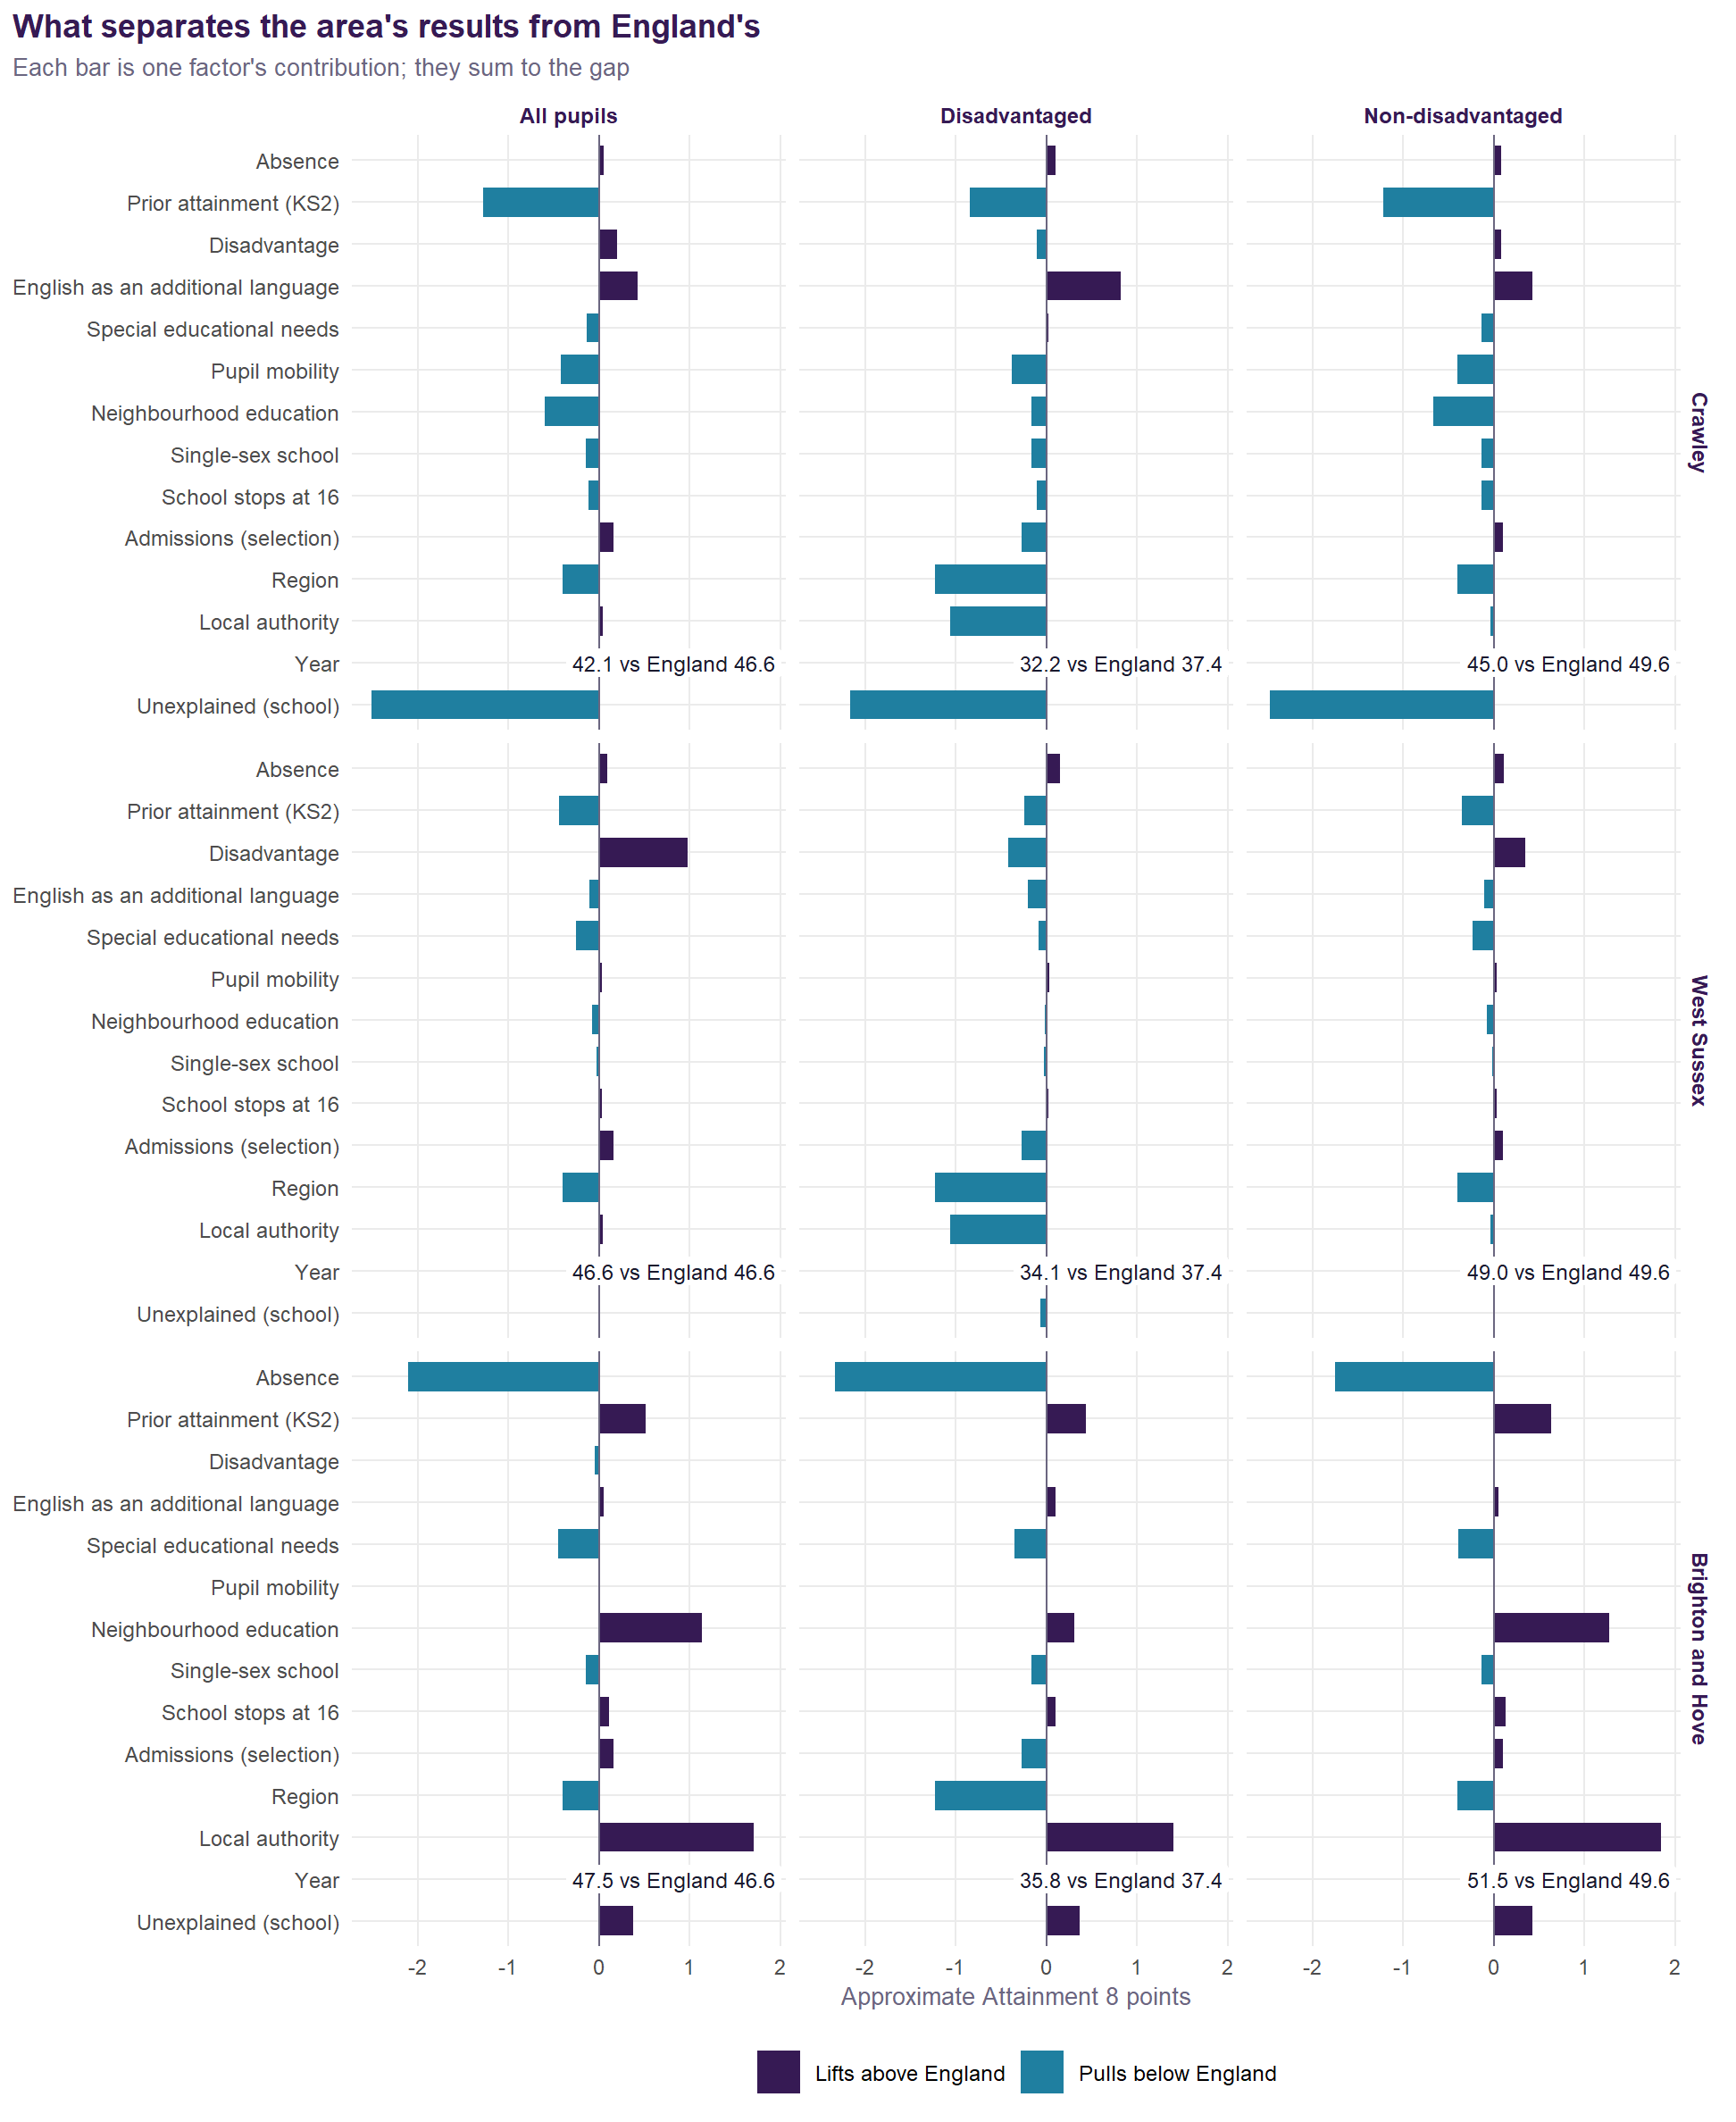
| Factor | All pupils | Disadvantaged | Non-disadvantaged |
|---|---|---|---|
| Unexplained (school) | -2.51 | -2.17 | -2.47 |
| Prior attainment (KS2) | -1.28 | -0.84 | -1.22 |
| Neighbourhood education | -0.60 | -0.16 | -0.66 |
| Pupil mobility | -0.42 | -0.39 | -0.40 |
| Place (region and local authority) | -0.36 | -2.29 | -0.44 |
| Single-sex school | -0.14 | -0.16 | -0.13 |
| Special educational needs | -0.14 | +0.03 | -0.13 |
| School stops at 16 | -0.12 | -0.11 | -0.14 |
| Absence | +0.05 | +0.10 | +0.08 |
| Other model terms | +0.17 | -0.27 | +0.11 |
| Disadvantage | +0.20 | -0.10 | +0.09 |
| English as an additional language | +0.42 | +0.82 | +0.42 |
For all pupils, Crawley is 4.7 points below England. The pieces of at least a quarter of a point:
- prior attainment (KS2) (-1.28);
- neighbourhood education (-0.60);
- English as an additional language (+0.42);
- pupil mobility (-0.42);
- region (-0.40);
- and the schools themselves (-2.51).
For disadvantaged pupils, Crawley is 5.6 points below England. The pieces of at least a quarter of a point:
- region (-1.23);
- local authority (-1.06);
- prior attainment (KS2) (-0.84);
- English as an additional language (+0.82);
- pupil mobility (-0.39);
- admissions (selection) (-0.28);
- and the schools themselves (-2.17).
For non-disadvantaged pupils, Crawley is 4.9 points below England. The pieces of at least a quarter of a point:
- prior attainment (KS2) (-1.22);
- neighbourhood education (-0.66);
- English as an additional language (+0.42);
- region (-0.40);
- pupil mobility (-0.40);
- and the schools themselves (-2.47).
Place: authorities and districts
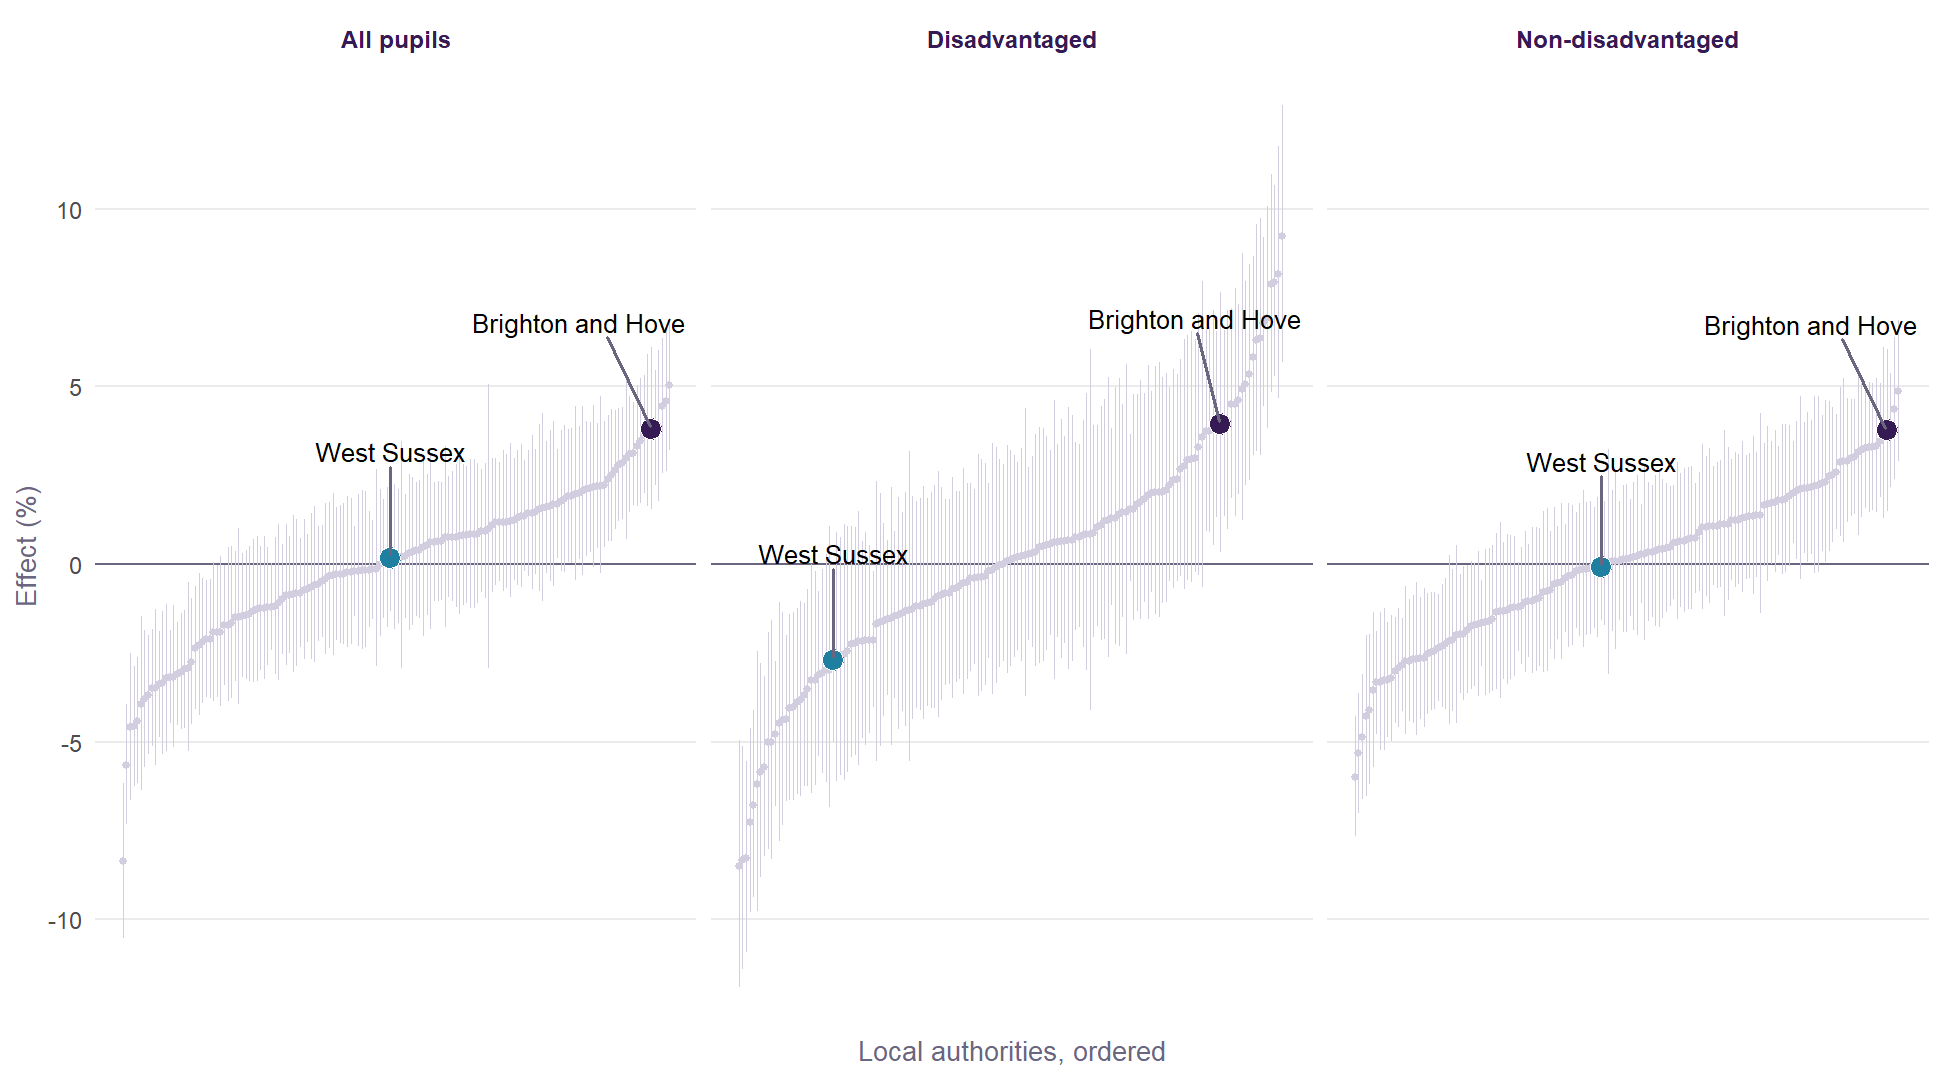
The district test adds a district level to the v2.1 model, with and without each school’s own record. An effect that disappears once schools are counted belongs to particular schools; one that survives is something the district’s schools share.
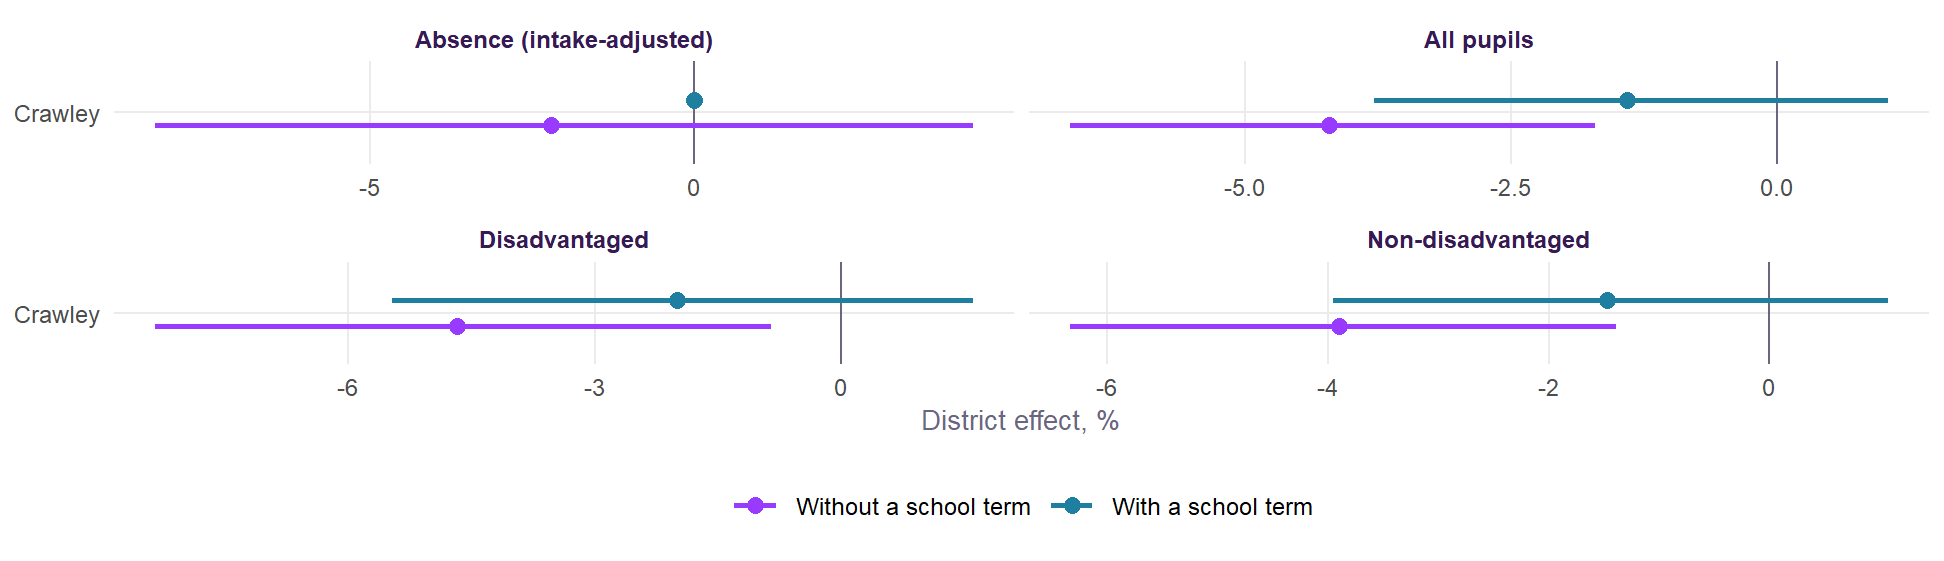
Without each school’s own record: Crawley for all pupils (-4.2%), Crawley for disadvantaged pupils (-4.7%) and Crawley for non-disadvantaged pupils (-3.9%). With it, none remains: the differences belong to particular schools, not to the districts as places.
Trusts
The v2.1 model with a multi-academy trust level, allowing for each school’s own record and for how it came to be an academy, so trusts that take on struggling schools are not penalised for it. Nationally a trust moves results by about 3.0%, and absence by about 6.5%.
The disadvantaged gap, and girls and boys
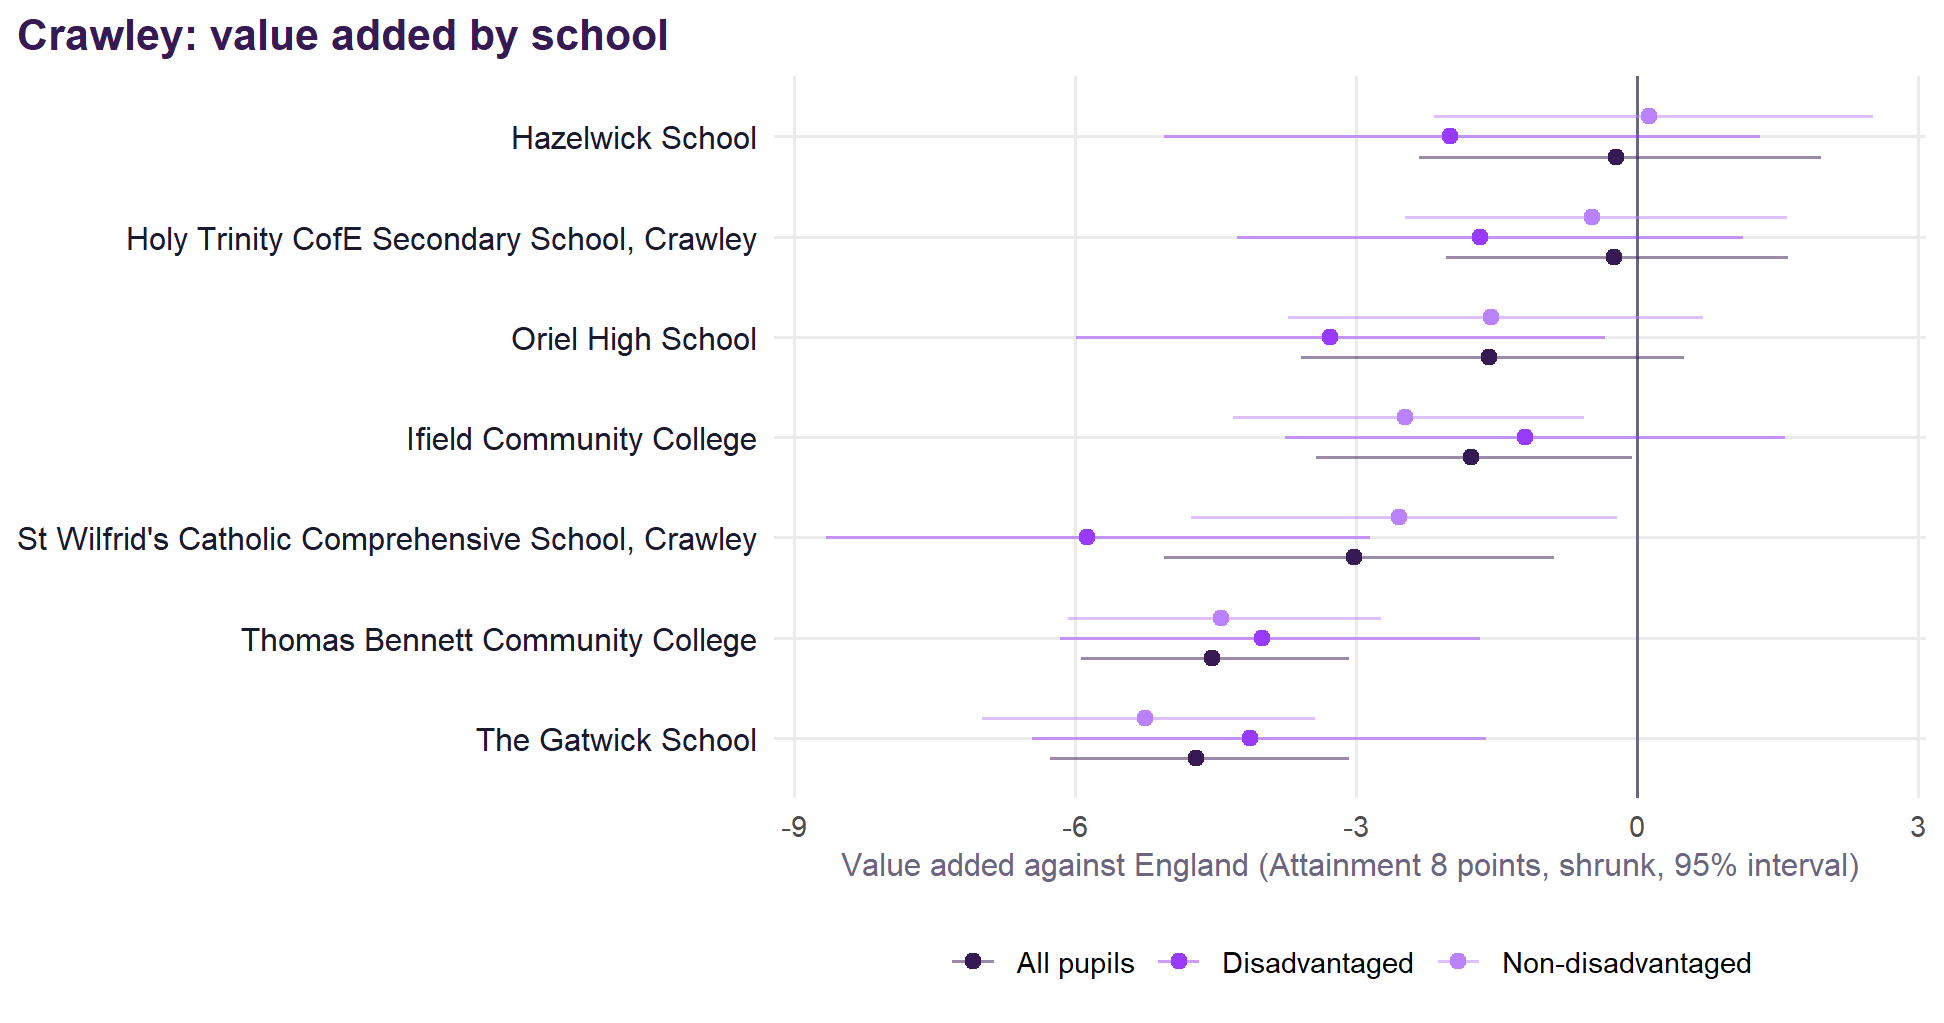
Of 7 schools:
- 0 are above expectation for both disadvantaged and non-disadvantaged pupils.
- 1 is above expectation for non-disadvantaged pupils but more than a point below it for disadvantaged ones: the gap schools.
- 0 have girls’ and boys’ value added more than two points apart.
| School | Disadvantaged | Non-disadvantaged | Gap |
|---|---|---|---|
| Gap schools: above for non-disadvantaged, more than a point below for disadvantaged | |||
| Hazelwick School | -2.0 | +0.1 | +2.1 |
Absence
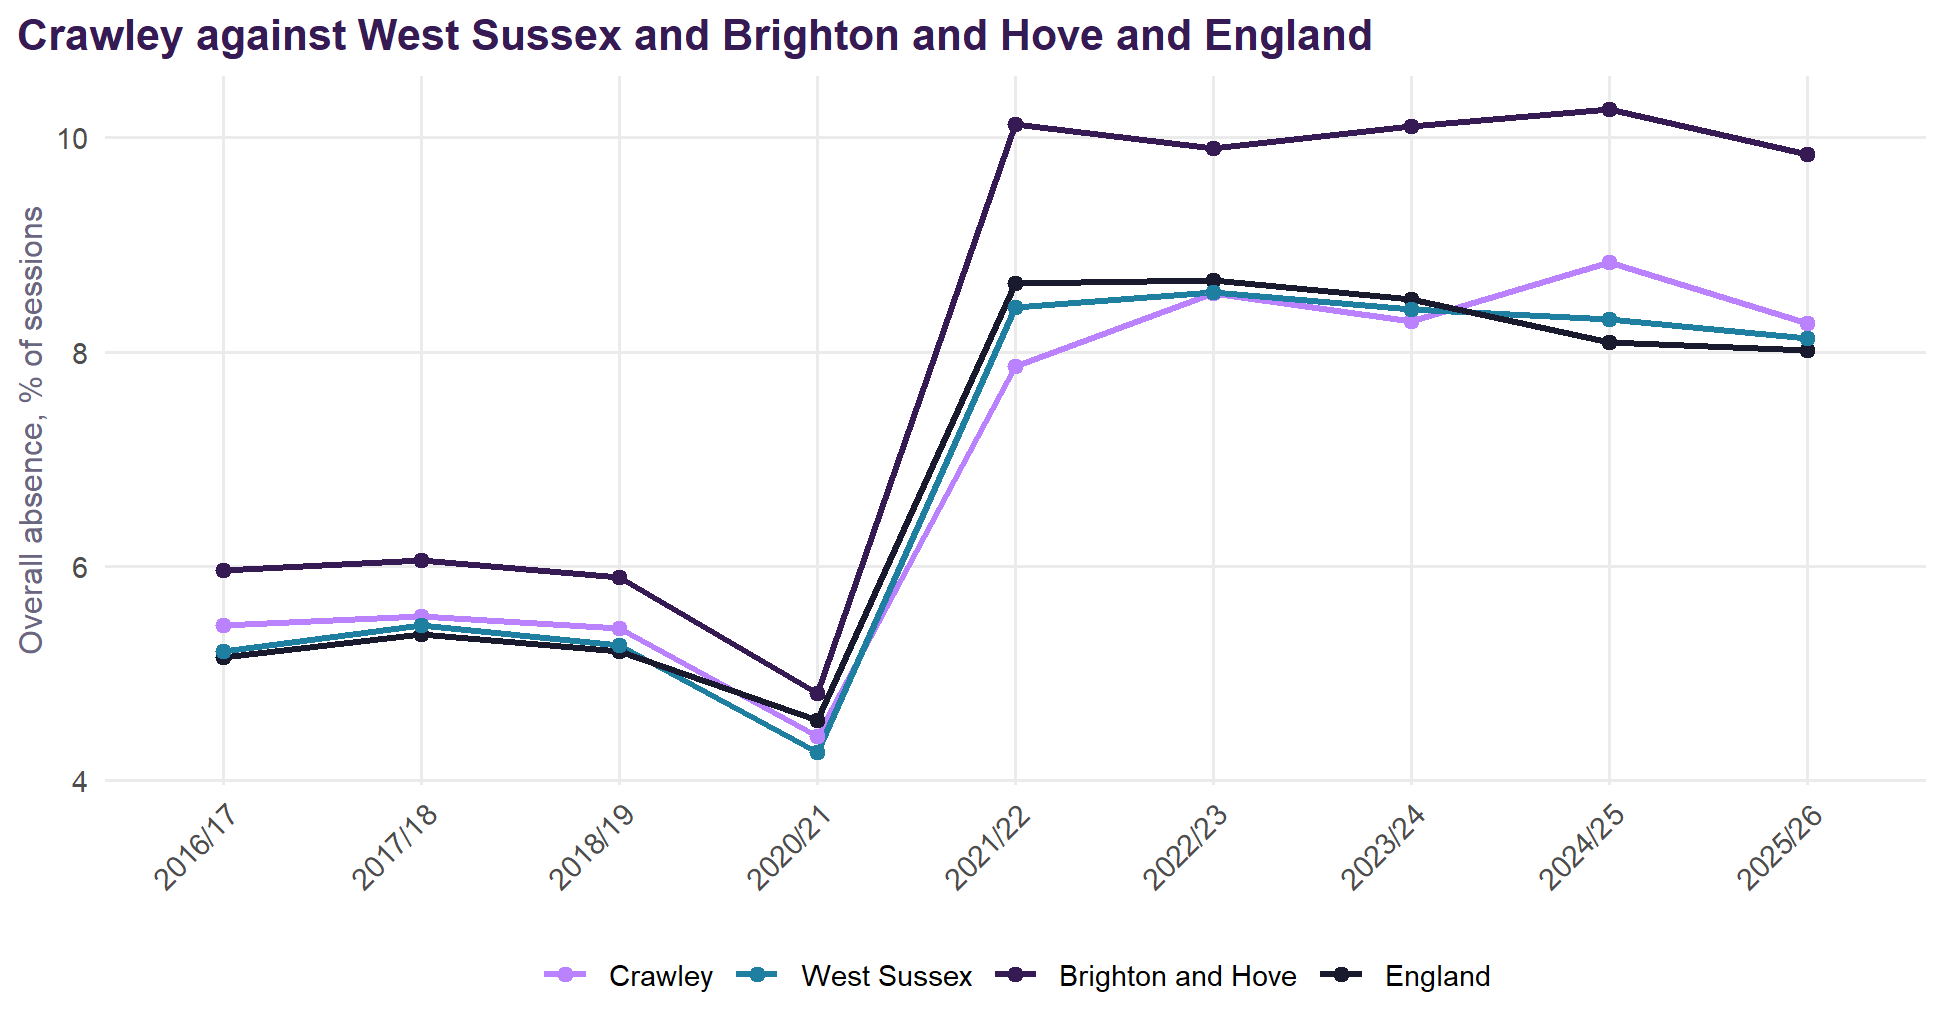
- 8.3% absence in autumn and spring 2025/26 (8.8% a year earlier), against 8.0% for England. These are all sessions together, so a large school counts for more than a small one; the full-year 2024/25 figures in what absence takes away are a mean of schools.
- Against its intake, on the v2.1 intake terms, the area’s schools ran 0.42 points below what their pupils’ profiles predict over 2021/22 to 2024/25 (West Sussex -0.28 and Brighton and Hove +1.67).
- Holy Trinity CofE Secondary School, Crawley runs more than a point above its prediction.
- Hazelwick School and St Wilfrid’s Catholic Comprehensive School, Crawley run more than a point below.
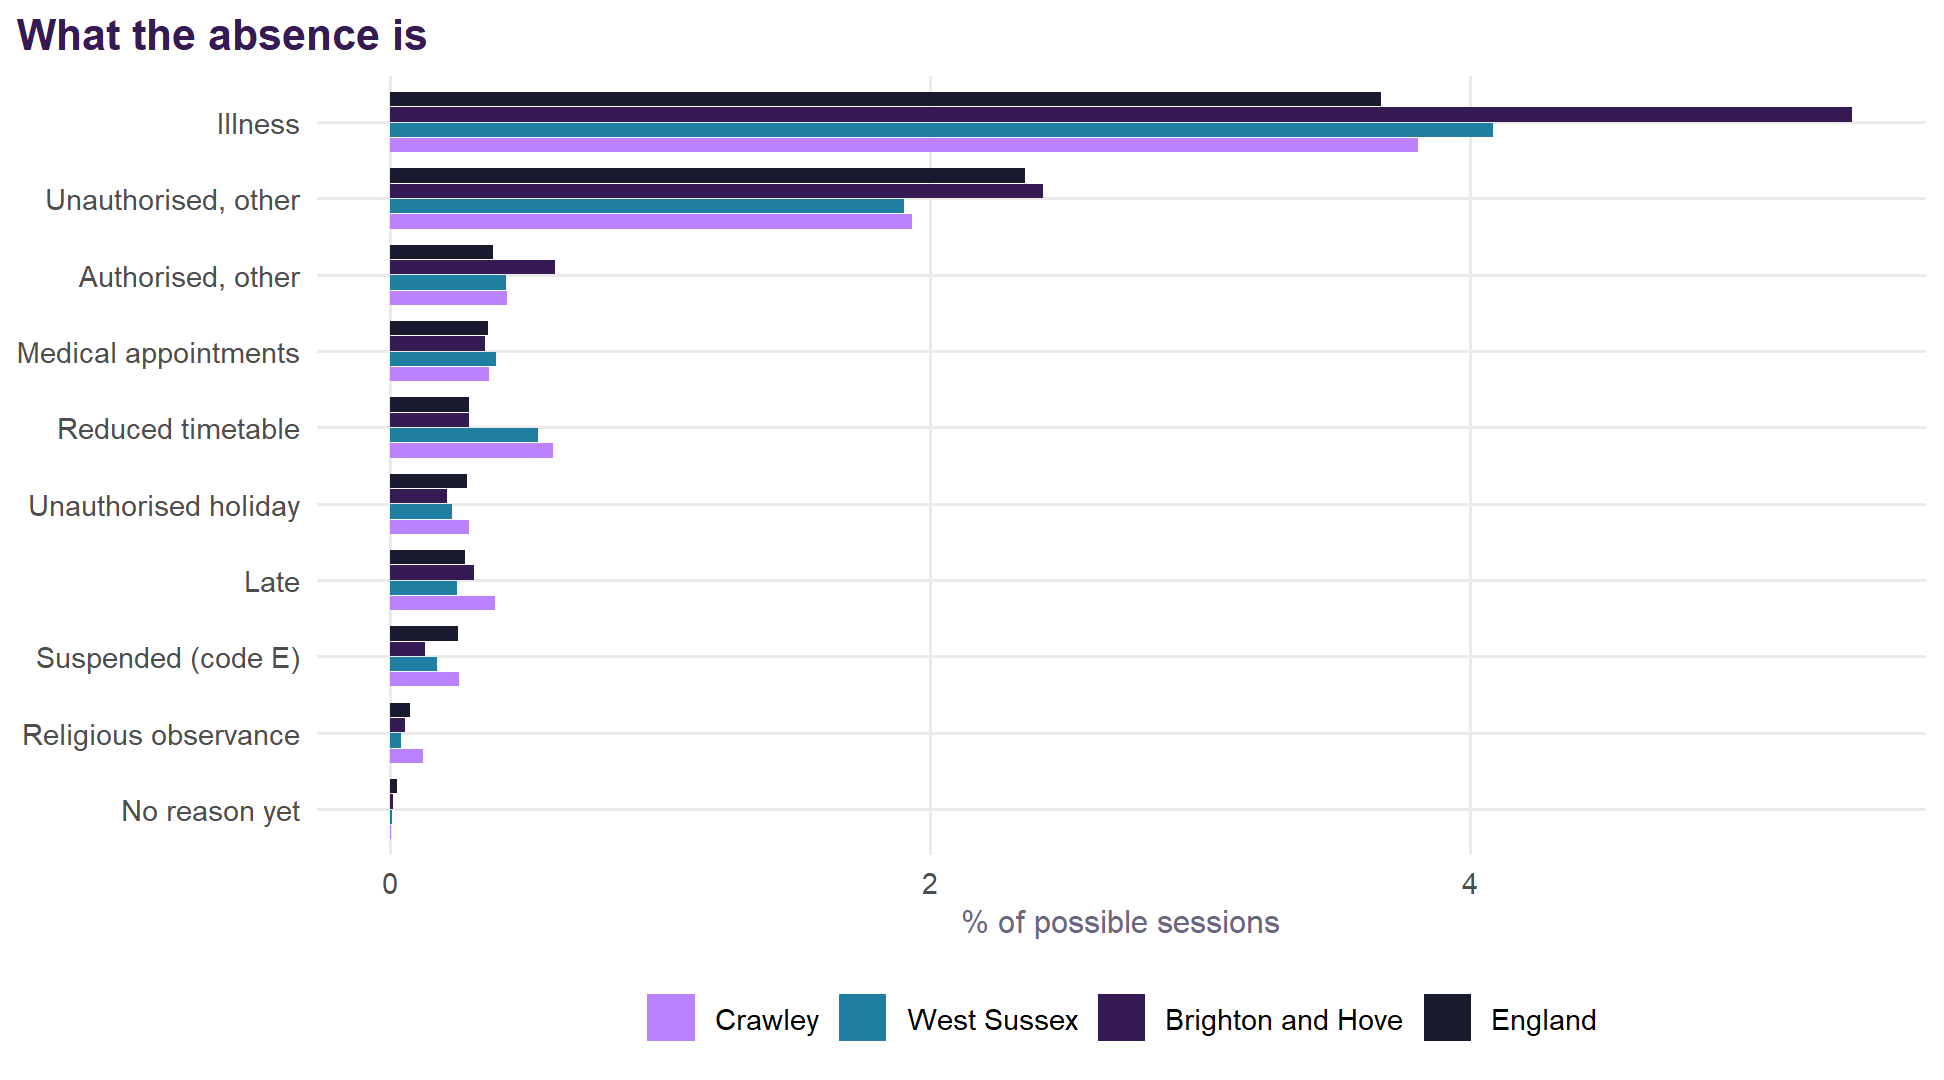
| School | Absence % | Predicted by intake % | Above prediction | Illness | Unauthorised | Reduced timetable | Suspended |
|---|---|---|---|---|---|---|---|
| Holy Trinity CofE Secondary School, Crawley | 10.5 | 9.2 | +1.3 | 3.8 | 3.2 | 1.39 | 0.41 |
| Thomas Bennett Community College | 11.3 | 11.0 | +0.3 | 4.4 | 2.3 | 0.52 | 0.73 |
| Ifield Community College | 9.6 | 10.0 | -0.5 | 3.7 | 2.9 | 0.46 | 0.16 |
| Oriel High School | 7.9 | 8.3 | -0.5 | 4.4 | 0.9 | 0.70 | 0.23 |
| The Gatwick School | 9.2 | 9.8 | -0.7 | 3.2 | 2.7 | 0.76 | 0.07 |
| St Wilfrid's Catholic Comprehensive School, Crawley | 6.7 | 8.0 | -1.2 | 3.2 | 1.0 | 0.28 | 0.05 |
| Hazelwick School | 6.6 | 8.3 | -1.7 | 3.6 | 1.1 | 0.23 | 0.15 |
What goes with absence here
The national absence analysis models seven kinds of absence in every secondary school in England, using autumn and spring 2025/26 and the January 2026 census. Here it is applied to Crawley’s 6 schools with full data. It compares them with England, with West Sussex and Sussex, and with the neighbouring districts (Horsham and Mid Sussex).
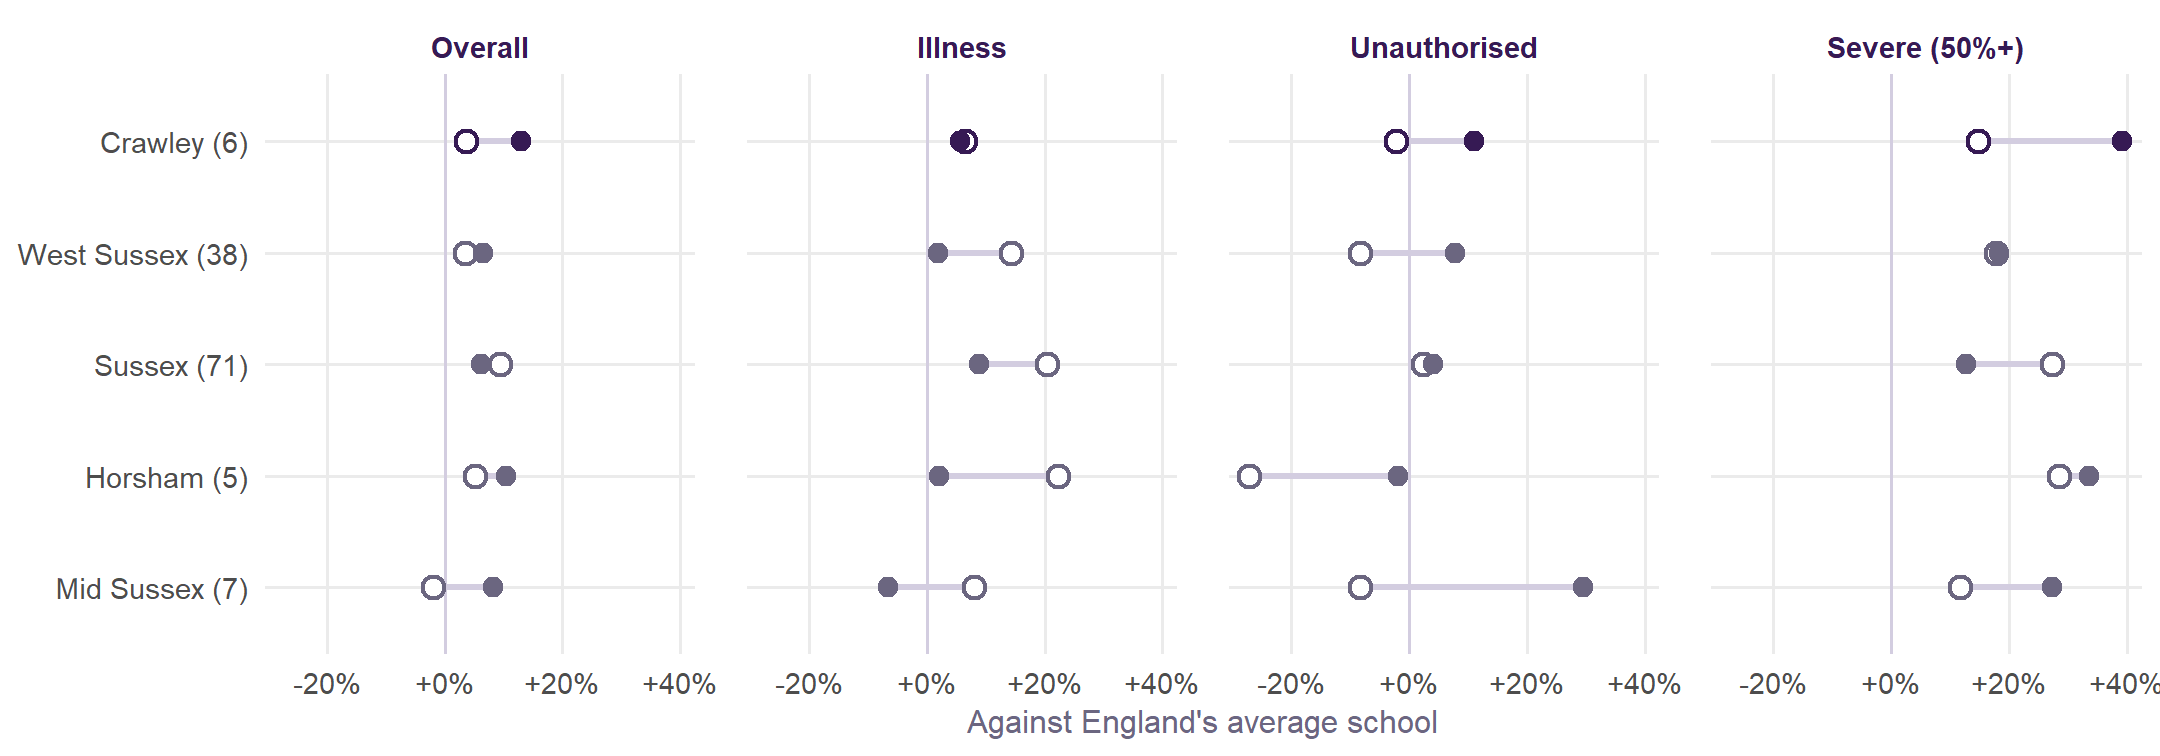
- Overall, Crawley’s schools have 4% more absence than England’s average school. Once their intake is allowed for, the difference is +13%.
- By kind, against England (in brackets, once intake is allowed for): illness is 6% higher (6% higher), unauthorised absence 2% lower (11% higher), and severe absence 15% higher (39% higher).
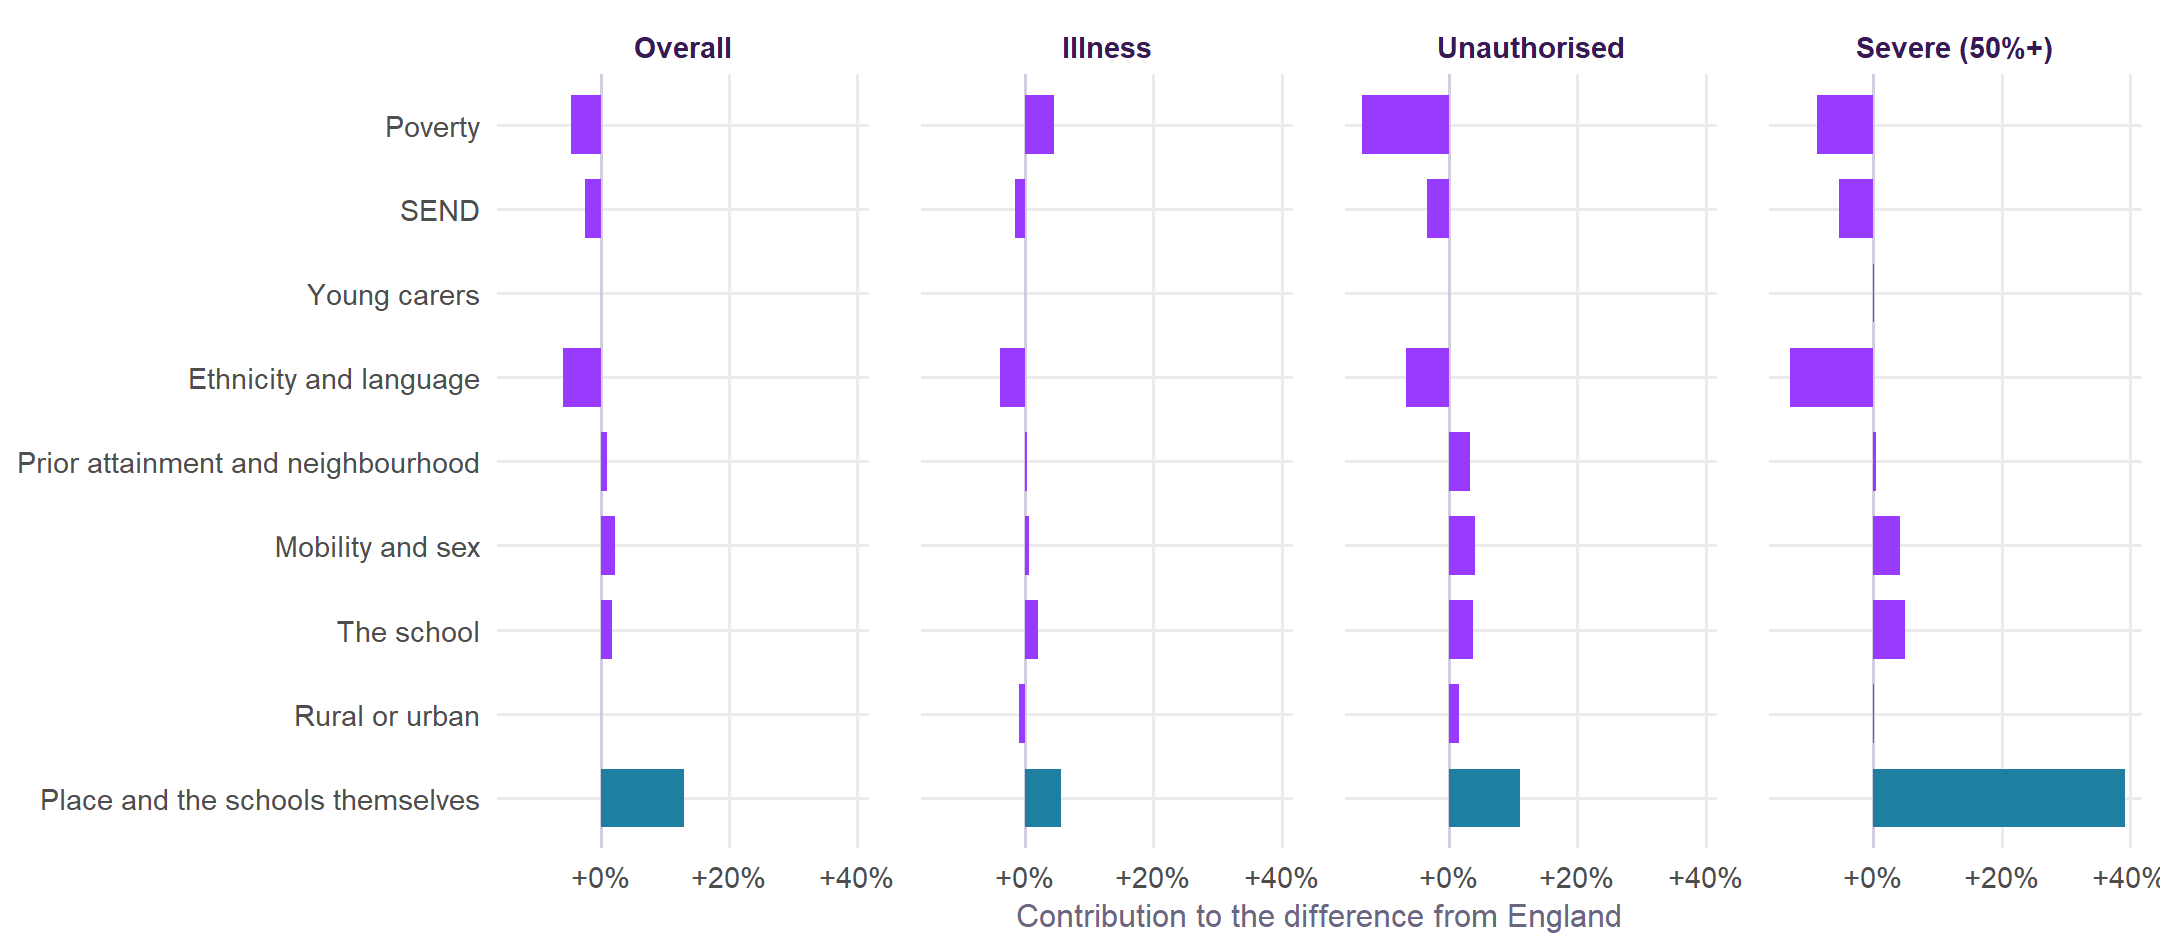
- What pushes absence up most here, against England, is mobility and sex (+2% overall). What holds it down most is ethnicity and language (-6%). For illness, the biggest push is poverty (+4%).
- West Sussex’s own effect, after intake: illness +4% (57th of 152 authorities), unauthorised +5% (52nd).
- Holy Trinity CofE Secondary School, Crawley, Thomas Bennett Community College and Oriel High School each run more than a point above the absence their intake predicts.
| School | Overall | Above prediction | Illness | Unauthorised | Severe (50%+) |
|---|---|---|---|---|---|
| Holy Trinity CofE Secondary School, Crawley | 10.8 (7.2) | +3.6 | 3.8 (3.4) | 4.3 (2.4) | 5.5 (2.4) |
| Thomas Bennett Community College | 10.0 (8.7) | +1.3 | 4.4 (3.5) | 3.3 (3.6) | 4.6 (3.9) |
| Oriel High School | 8.4 (7.3) | +1.1 | 4.4 (4.1) | 1.7 (2.0) | 3.3 (2.7) |
| The Gatwick School | 8.1 (8.0) | +0.2 | 3.2 (3.8) | 3.1 (2.9) | 4.9 (3.6) |
| Hazelwick School | 6.4 (6.5) | -0.1 | 3.6 (3.5) | 1.7 (1.8) | 2.0 (2.1) |
| St Wilfrid's Catholic Comprehensive School, Crawley | 6.0 (6.4) | -0.4 | 3.2 (3.8) | 1.5 (1.6) | 1.8 (1.9) |
For heads and governors
The national page sets out what the school’s part in absence is. In short:
- Who runs a school, its size and its religious character make little difference to absence once intake is allowed for.
- Schools with the same intake can differ a great deal, and the differences persist from year to year.
The table compares each of Crawley’s schools with similar schools in its own authority, in 2024/25 and 2025/26. Click a school to open it in Find a twin, which finds its look-alikes across England, and the look-alikes that do much better.
- Holy Trinity CofE Secondary School, Crawley has unauthorised absence more than 20% above similar schools in both years. That is the pattern worth asking about.
| School | Overall 24/25 | Overall 25/26 | Unauthorised 24/25 | Unauthorised 25/26 | Severe 24/25 | Severe 25/26 |
|---|---|---|---|---|---|---|
| Holy Trinity CofE Secondary School, Crawley | +48% | +44% | +83% | +78% | +110% | +116% |
| The Gatwick School | +3% | -2% | +12% | +9% | +61% | +29% |
| St Wilfrid's Catholic Comprehensive School, Crawley | -8% | -10% | -21% | -5% | -28% | -7% |
| Thomas Bennett Community College | +18% | +11% | +48% | -8% | +37% | +10% |
| Hazelwick School | -9% | -5% | -12% | -9% | -40% | -10% |
| Oriel High School | +3% | +10% | -5% | -16% | -4% | +19% |
Suspensions were 18.5 episodes per 100 pupils in 2024/25, against 21.2 for England. One pupil can be suspended several times: 7.0 pupils per 100 were suspended at least once, about 2.7 times each, against 7.3 per 100 and 2.9 times in England. Reduced timetables take 0.60% of sessions, 2.1 times England’s rate.
| School | Pupils | Suspension episodes per 100 | Pupils suspended per 100 | Permanent exclusions |
|---|---|---|---|---|
| Thomas Bennett Community College | 1262 | 60.8 | 13.7 | 7 |
| Holy Trinity CofE Secondary School, Crawley | 1359 | 22.1 | 8.8 | 0 |
| Hazelwick School | 1890 | 15.3 | 7.9 | 6 |
| Ifield Community College | 1204 | 12.2 | 6.1 | 6 |
| The Gatwick School | 846 | 7.8 | 4.4 | 1 |
| Oriel High School | 1478 | 5.8 | 4.0 | 2 |
| St Wilfrid's Catholic Comprehensive School, Crawley | 1174 | 3.8 | 2.6 | 2 |
| School | Absence % | Gain, all pupils | Gain, disadvantaged |
|---|---|---|---|
| Holy Trinity CofE Secondary School, Crawley | 11.9 | +3.3 | +3.7 |
| Thomas Bennett Community College | 11.6 | +2.3 | +2.6 |
| Ifield Community College | 10.9 | +2.3 | +2.6 |
| The Gatwick School | 9.2 | +0.6 | +0.6 |
| Oriel High School | 8.8 | +0.3 | +0.3 |
Over time
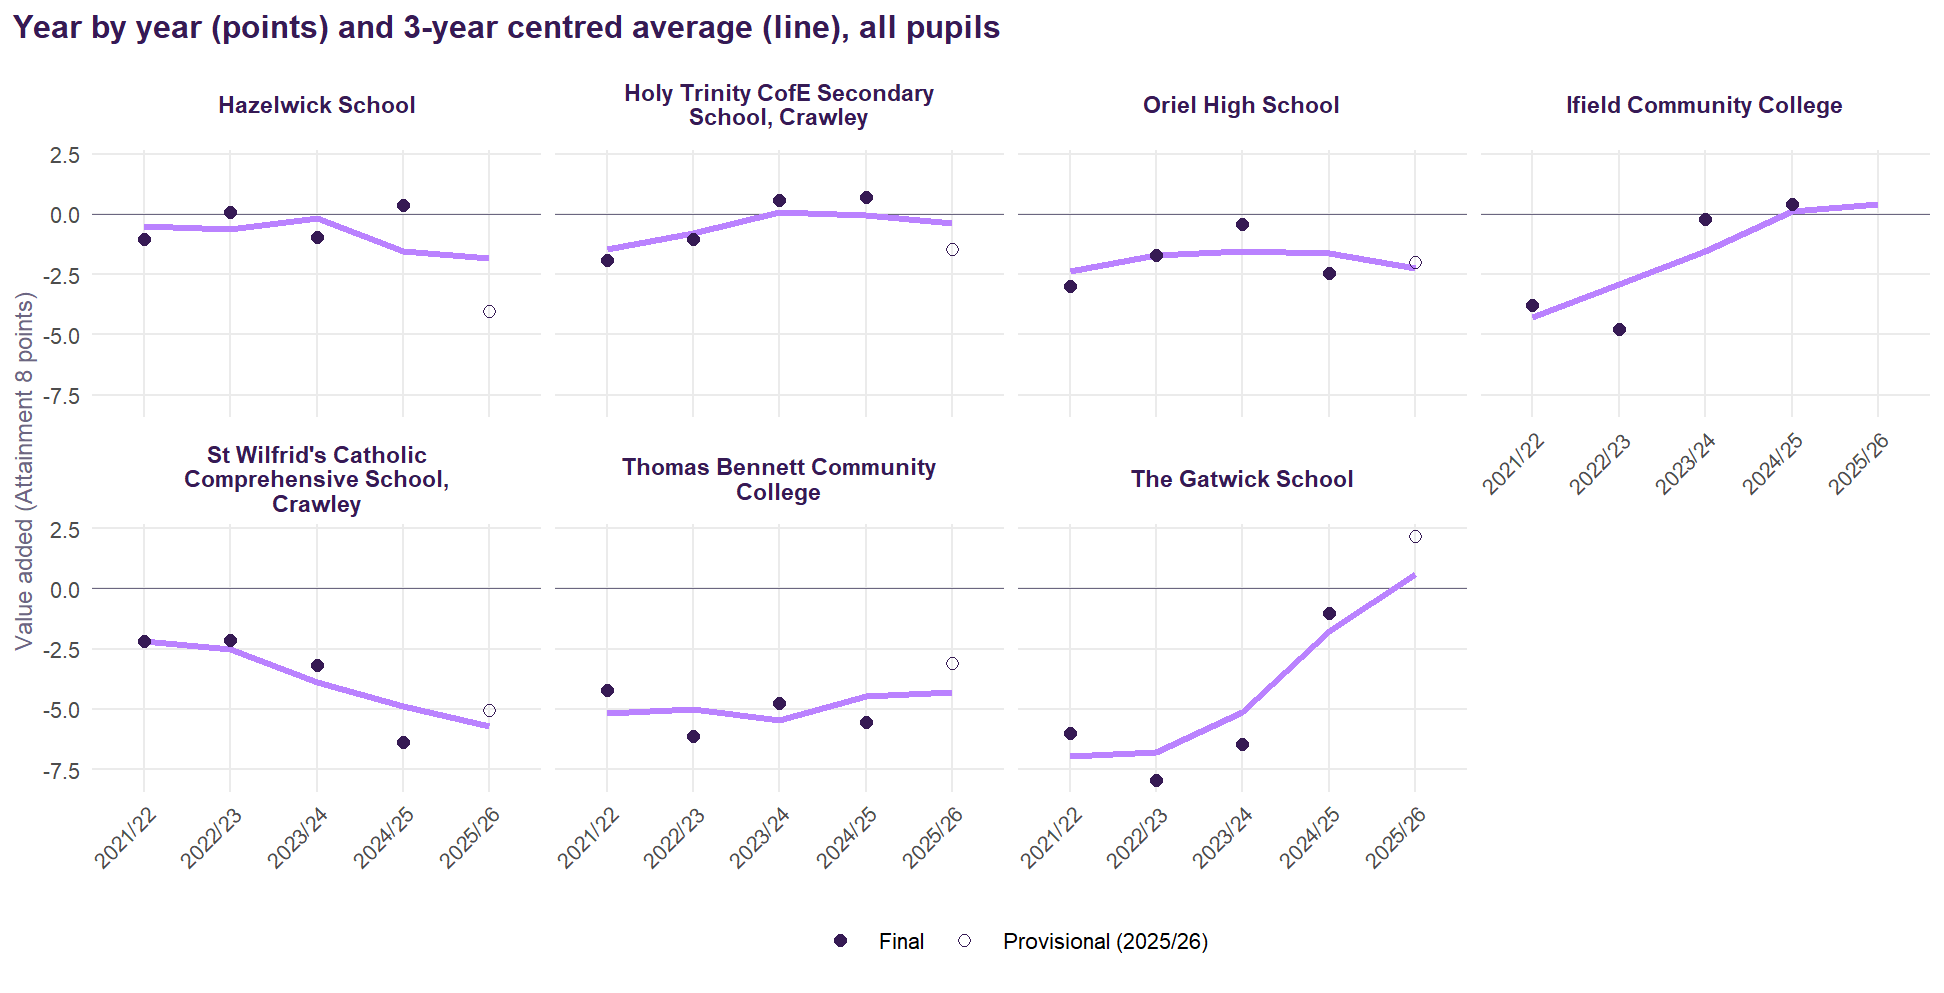
Value added is computed for every year separately, then averaged. A single year moves a good deal; a three-year moving average centred on a year (that year, the one before and the one after) shows the trajectory more steadily. Years at the ends use the years they have. 2025/26 is provisional and shown as a hollow point. The explorer lets you choose the centre year and the window.
On the three-year centred average from 2022/23 to 2024/25, the largest rises are at The Gatwick School (+5.0) and Ifield Community College (+3.0) and the largest falls at Hazelwick School (-0.9) and St Wilfrid’s Catholic Comprehensive School, Crawley (-2.3). The later windows include the provisional 2025/26 year.
| School | 2022/23 | 2023/24 | 2024/25 |
|---|---|---|---|
| Ifield Community College | -2.9 | -1.5 | +0.1 |
| Holy Trinity CofE Secondary School, Crawley | -0.8 | +0.1 | -0.1 |
| Hazelwick School | -0.6 | -0.2 | -1.5 |
| Oriel High School | -1.7 | -1.5 | -1.6 |
| The Gatwick School | -6.8 | -5.1 | -1.8 |
| Thomas Bennett Community College | -5.0 | -5.5 | -4.5 |
| St Wilfrid's Catholic Comprehensive School, Crawley | -2.5 | -3.9 | -4.9 |
Contextual league tables
Warning2025/26 is provisional
2025/26 is provisional: predicted from the v2.1 model using DfE’s provisional KS4 results (October 2026), with absence bridged from autumn and spring and the intake data not yet published carried forward. It will be updated with the revised KS4 release in February 2027. It is shown beside the four-year figure, not averaged into it, and is not shrunk: one provisional year of a school’s results moves a good deal.
| School | 2021/22 | 2022/23 | 2023/24 | 2024/25 | v2.1, four years (shrunk) | 95% interval | 2025/26 (provisional) |
|---|---|---|---|---|---|---|---|
| Hazelwick School | -1.1 | +0.1 | -1.0 | +0.4 | -0.2 | -2.3 to +2.0 | -4.0 |
| Holy Trinity CofE Secondary School, Crawley | -1.9 | -1.1 | +0.6 | +0.7 | -0.2 | -2.0 to +1.6 | -1.4 |
| Oriel High School | -3.0 | -1.7 | -0.4 | -2.5 | -1.6 | -3.6 to +0.5 | -2.0 |
| Ifield Community College | -3.8 | -4.8 | -0.2 | +0.4 | -1.8 | -3.4 to -0.1 | |
| St Wilfrid's Catholic Comprehensive School, Crawley | -2.2 | -2.2 | -3.2 | -6.4 | -3.0 | -5.1 to -0.9 | -5.0 |
| Thomas Bennett Community College | -4.2 | -6.1 | -4.8 | -5.5 | -4.5 | -5.9 to -3.1 | -3.1 |
| The Gatwick School | -6.0 | -7.9 | -6.4 | -1.0 | -4.7 | -6.3 to -3.1 | +2.2 |
| School | 2021/22 | 2022/23 | 2023/24 | 2024/25 | v2.1, four years (shrunk) | 95% interval | 2025/26 (provisional) |
|---|---|---|---|---|---|---|---|
| Ifield Community College | -2.6 | -3.8 | -0.7 | -0.1 | -1.2 | -3.8 to +1.6 | |
| Holy Trinity CofE Secondary School, Crawley | -5.8 | -2.9 | -1.3 | +0.1 | -1.7 | -4.3 to +1.1 | -4.6 |
| Hazelwick School | -3.0 | -4.2 | -1.9 | -2.4 | -2.0 | -5.1 to +1.3 | -5.8 |
| Oriel High School | -2.5 | -2.9 | -3.0 | -8.6 | -3.3 | -6.0 to -0.3 | -5.8 |
| Thomas Bennett Community College | -3.9 | -5.8 | -5.6 | -5.9 | -4.0 | -6.2 to -1.7 | -6.5 |
| The Gatwick School | -5.6 | -9.6 | -2.3 | -4.2 | -4.1 | -6.5 to -1.6 | +0.4 |
| St Wilfrid's Catholic Comprehensive School, Crawley | -8.9 | -5.4 | -6.6 | -10.0 | -5.9 | -8.7 to -2.8 | -4.0 |
| School | 2021/22 | 2022/23 | 2023/24 | 2024/25 | v2.1, four years (shrunk) | 95% interval | 2025/26 (provisional) |
|---|---|---|---|---|---|---|---|
| Hazelwick School | -0.7 | +0.9 | -0.9 | +0.7 | +0.1 | -2.2 to +2.5 | -4.0 |
| Holy Trinity CofE Secondary School, Crawley | -1.7 | -1.4 | +0.3 | +0.1 | -0.5 | -2.5 to +1.6 | -0.7 |
| Oriel High School | -3.0 | -1.9 | -0.5 | -2.3 | -1.6 | -3.7 to +0.7 | -2.2 |
| Ifield Community College | -5.0 | -5.8 | -0.8 | -0.1 | -2.5 | -4.3 to -0.6 | |
| St Wilfrid's Catholic Comprehensive School, Crawley | -1.4 | -1.7 | -2.7 | -6.2 | -2.5 | -4.8 to -0.2 | -5.6 |
| Thomas Bennett Community College | -4.9 | -6.3 | -4.2 | -5.2 | -4.4 | -6.1 to -2.7 | -2.4 |
| The Gatwick School | -6.9 | -7.9 | -8.2 | -1.1 | -5.3 | -7.0 to -3.4 | +1.7 |
| School | 2021/22 | 2022/23 | 2023/24 | 2024/25 | v2.1, four years (shrunk) | 95% interval | 2025/26 (provisional) |
|---|---|---|---|---|---|---|---|
| Hazelwick School | -0.2 | -1.1 | -0.7 | +1.2 | -0.0 | -2.6 to +2.8 | -3.1 |
| Holy Trinity CofE Secondary School, Crawley | -0.9 | -2.3 | +0.3 | +1.7 | -0.1 | -2.4 to +2.2 | -4.3 |
| Ifield Community College | -4.0 | -5.2 | -1.2 | -0.1 | -2.1 | -4.1 to +0.1 | |
| Oriel High School | -4.5 | -3.5 | -2.2 | -1.9 | -2.3 | -4.8 to +0.3 | -0.9 |
| St Wilfrid's Catholic Comprehensive School, Crawley | -3.1 | -4.4 | -4.3 | -5.2 | -3.4 | -5.9 to -0.7 | -8.4 |
| Thomas Bennett Community College | -1.6 | -8.7 | -5.4 | -2.0 | -3.7 | -5.5 to -1.8 | -5.2 |
| The Gatwick School | -7.6 | -4.9 | -8.7 | -1.6 | -4.6 | -6.6 to -2.6 | +1.5 |
| School | 2021/22 | 2022/23 | 2023/24 | 2024/25 | v2.1, four years (shrunk) | 95% interval | 2025/26 (provisional) |
|---|---|---|---|---|---|---|---|
| Hazelwick School | -2.2 | +1.2 | -1.1 | -0.2 | -0.3 | -2.9 to +2.4 | -4.9 |
| Holy Trinity CofE Secondary School, Crawley | -3.8 | +0.1 | +0.6 | +0.1 | -0.5 | -2.7 to +1.8 | +1.3 |
| Oriel High School | -1.9 | -0.0 | +1.0 | -3.5 | -0.8 | -3.4 to +1.8 | -3.3 |
| Ifield Community College | -3.6 | -4.0 | +0.8 | +1.0 | -1.1 | -3.2 to +1.1 | |
| St Wilfrid's Catholic Comprehensive School, Crawley | -1.7 | +0.2 | -2.4 | -7.8 | -2.4 | -4.9 to +0.3 | -2.0 |
| The Gatwick School | -4.4 | -11.6 | -4.7 | -0.5 | -4.5 | -6.4 to -2.4 | +2.7 |
| Thomas Bennett Community College | -6.8 | -3.6 | -3.9 | -8.3 | -4.6 | -6.4 to -2.8 | -0.9 |
Questions for discussion
- Disadvantaged pupils. Their value added averages -3.2 points across Crawley’s schools against -2.4 for other pupils. No school here is above expectation for them; what do schools elsewhere with similar intakes do differently?
- Attendance is not the area’s main lever, though individual schools above their predicted absence are worth a look.
- Schools, not the place. No district effect survives each school’s own record on v2.1: the differences that matter are between schools.
- Practice. In Crawley, reduced timetables run at 2.1 times the national rate. These are choices made within schools.
- The authority. West Sussex’s own v2.1 effect for disadvantaged pupils is -2.7% (125th of 151), distinguishable from zero, and for non-disadvantaged pupils -0.1% (83rd).
Notes on method
Value Added v2.1 is described on the method page. The absence-against-intake measure, the district test, the trust analysis, the attendance-counted-in value added and the scenarios are refitted on the v2.1 specification by R/04_place_and_absence.R. The absence series, reasons and suspensions are the original project’s (R/17_area_analysis.R). School districts come from each school’s postcode. The decomposition splits each area’s mean log Attainment 8 against England’s into one piece per model term, exactly, and converts to points at England’s mean. This page is generated from templates/area.qmd by R/03_area_pages.R; the format is recorded in AREA_REPORTS.md.