Challenges in Transitioning the UK to ‘Net-Zero’ – Some Observations from Housing and Transport
August 30, 2024
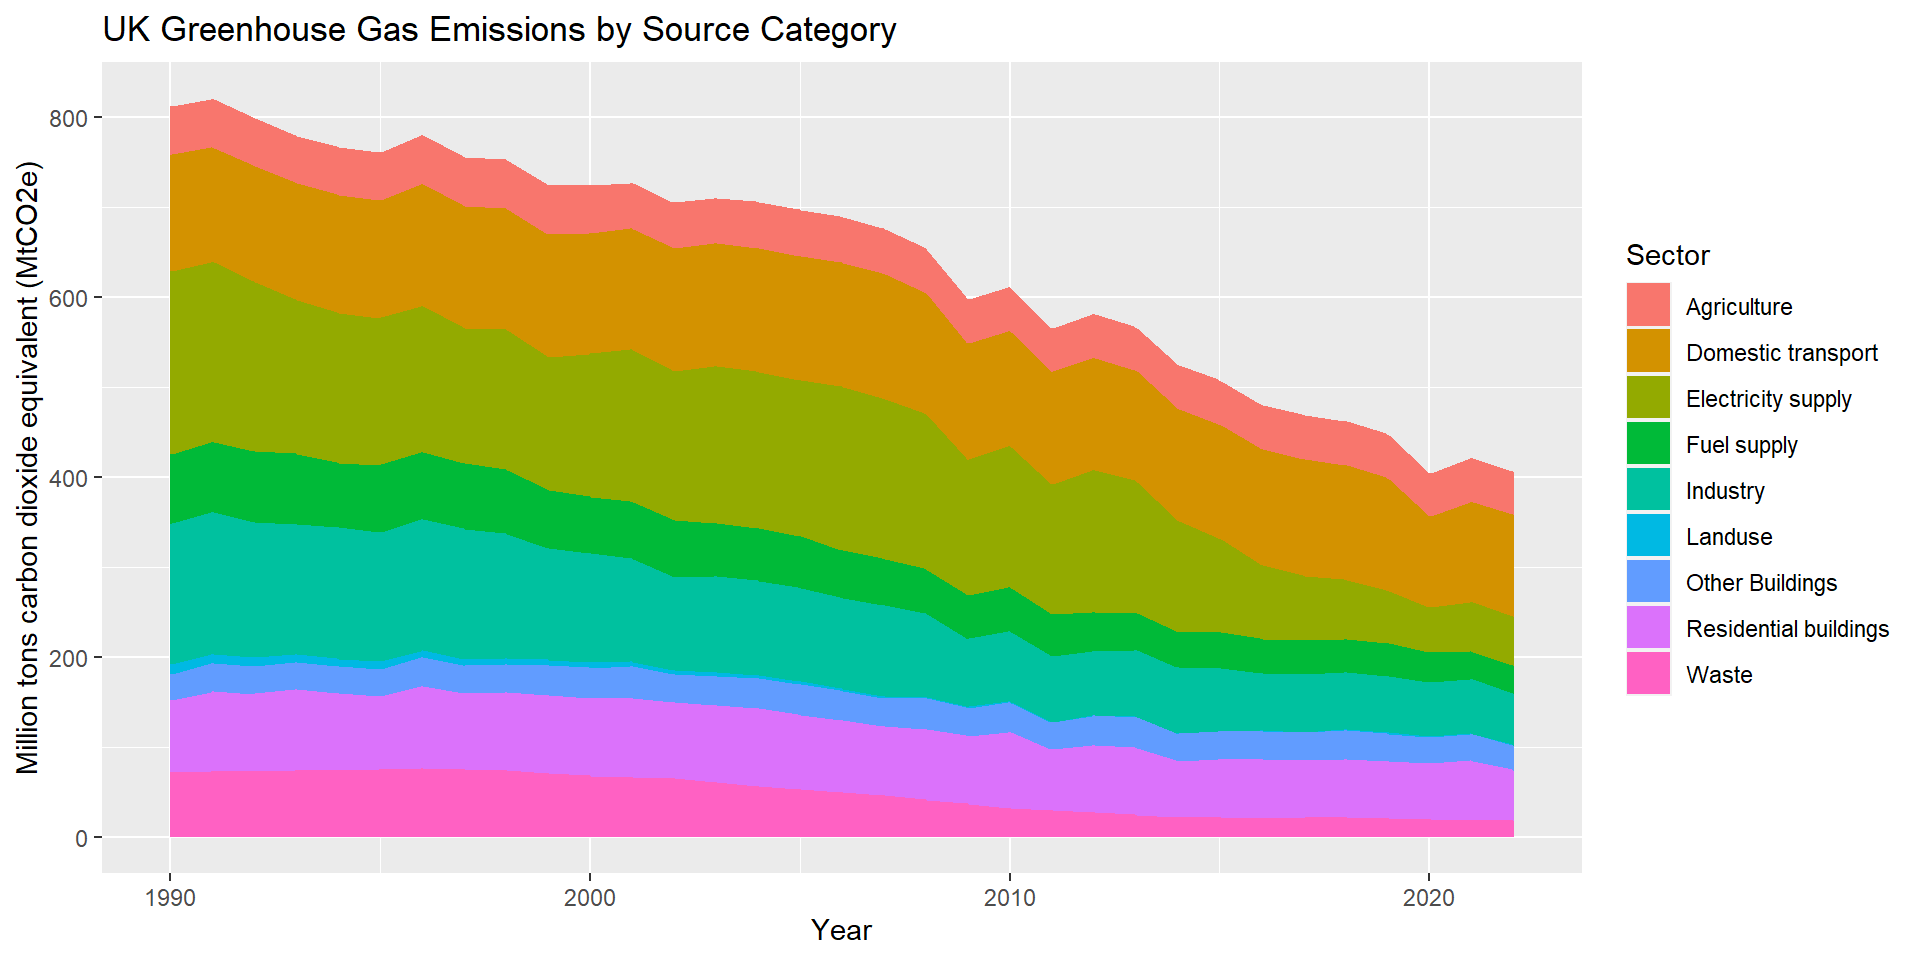
UK Housing and CO2 Emissions
Source: Eurostat + UK Government
- Housing in the UK is some of the worst, overall, in Europe for emitting greenhouse gases.
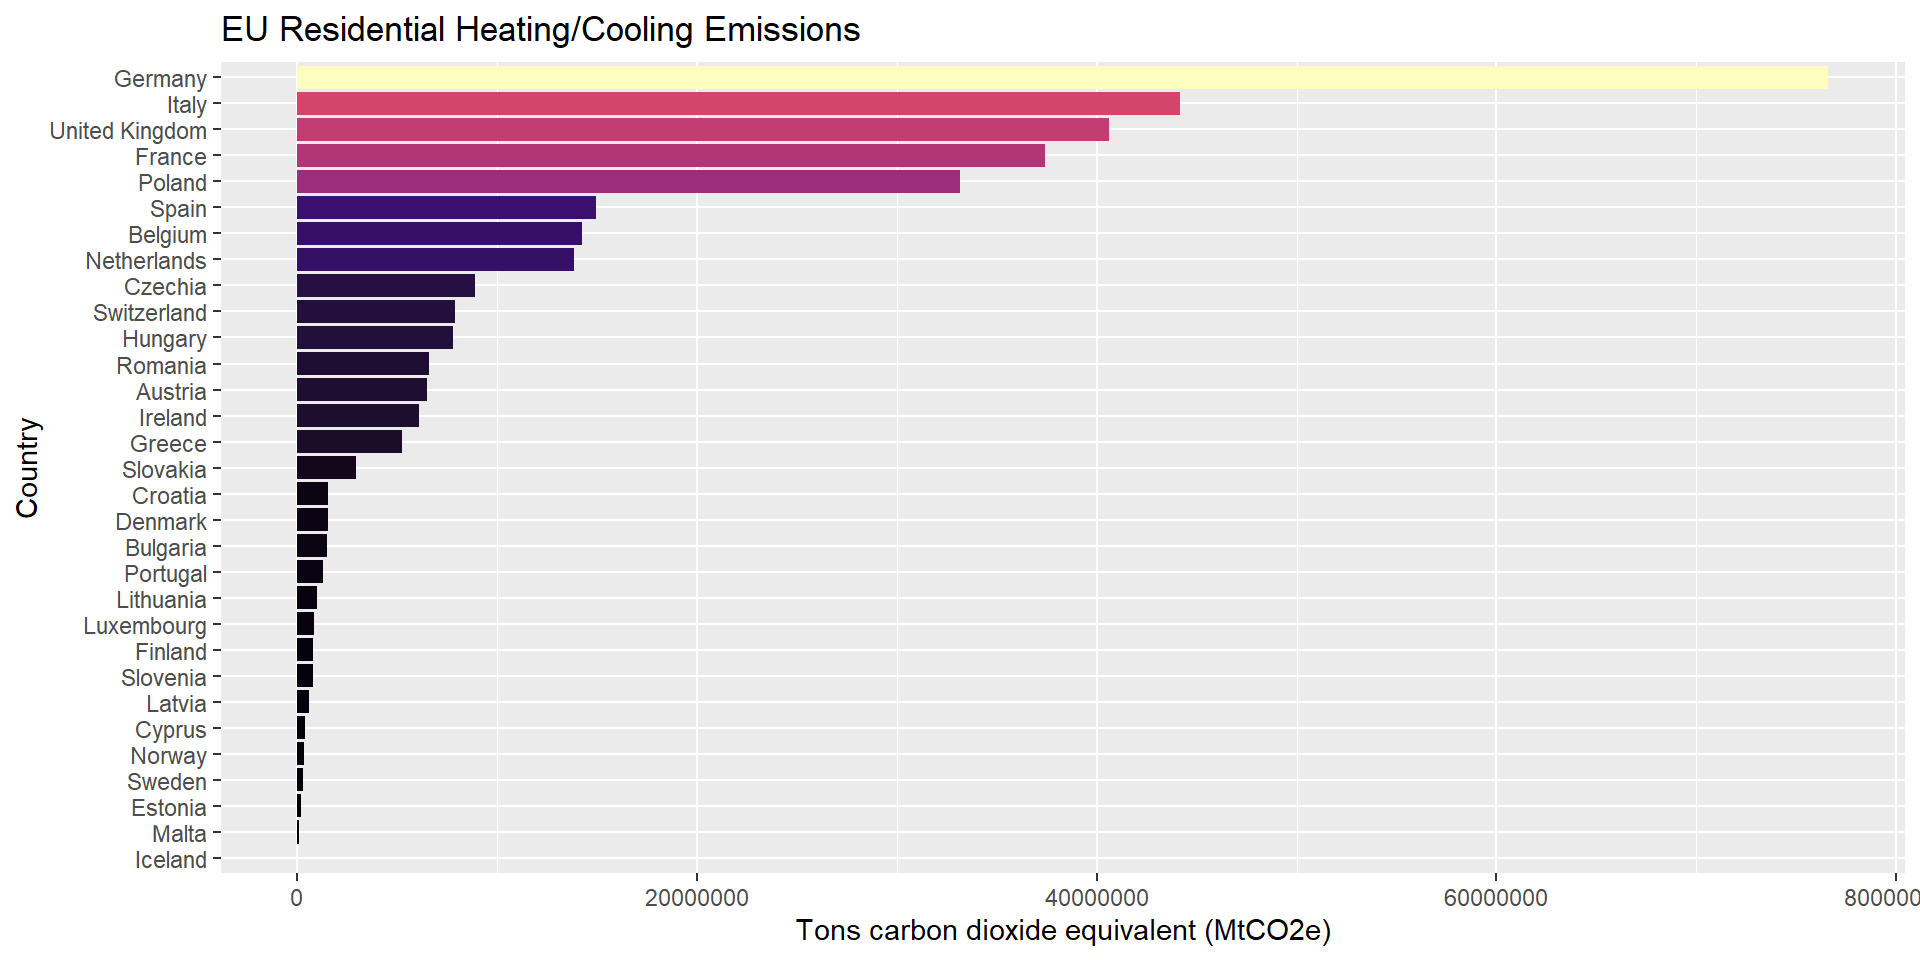
UK Housing and CO2 Emissions
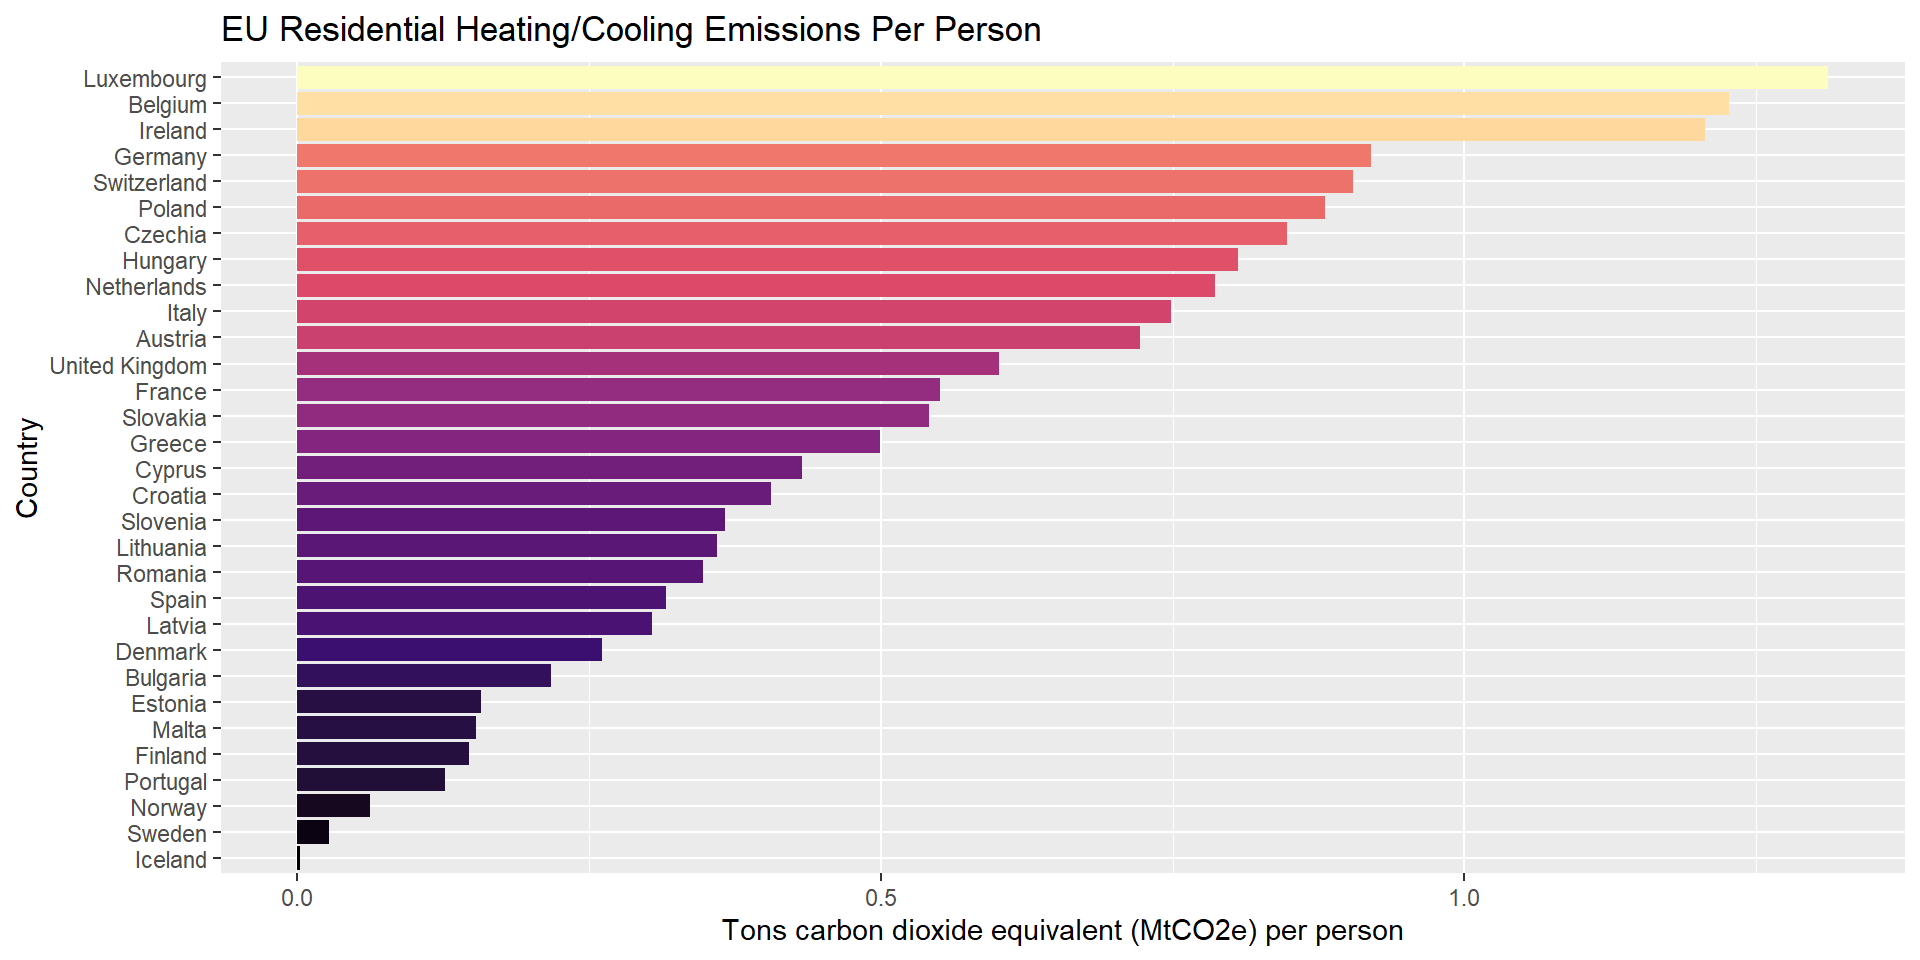
Source: Eurostat + UK Government
- Even after adjusting for population, UK housing stock is responsible for emitting far more CO2 than housing in countries with much colder climates like Iceland, Sweden, Norway and Finland
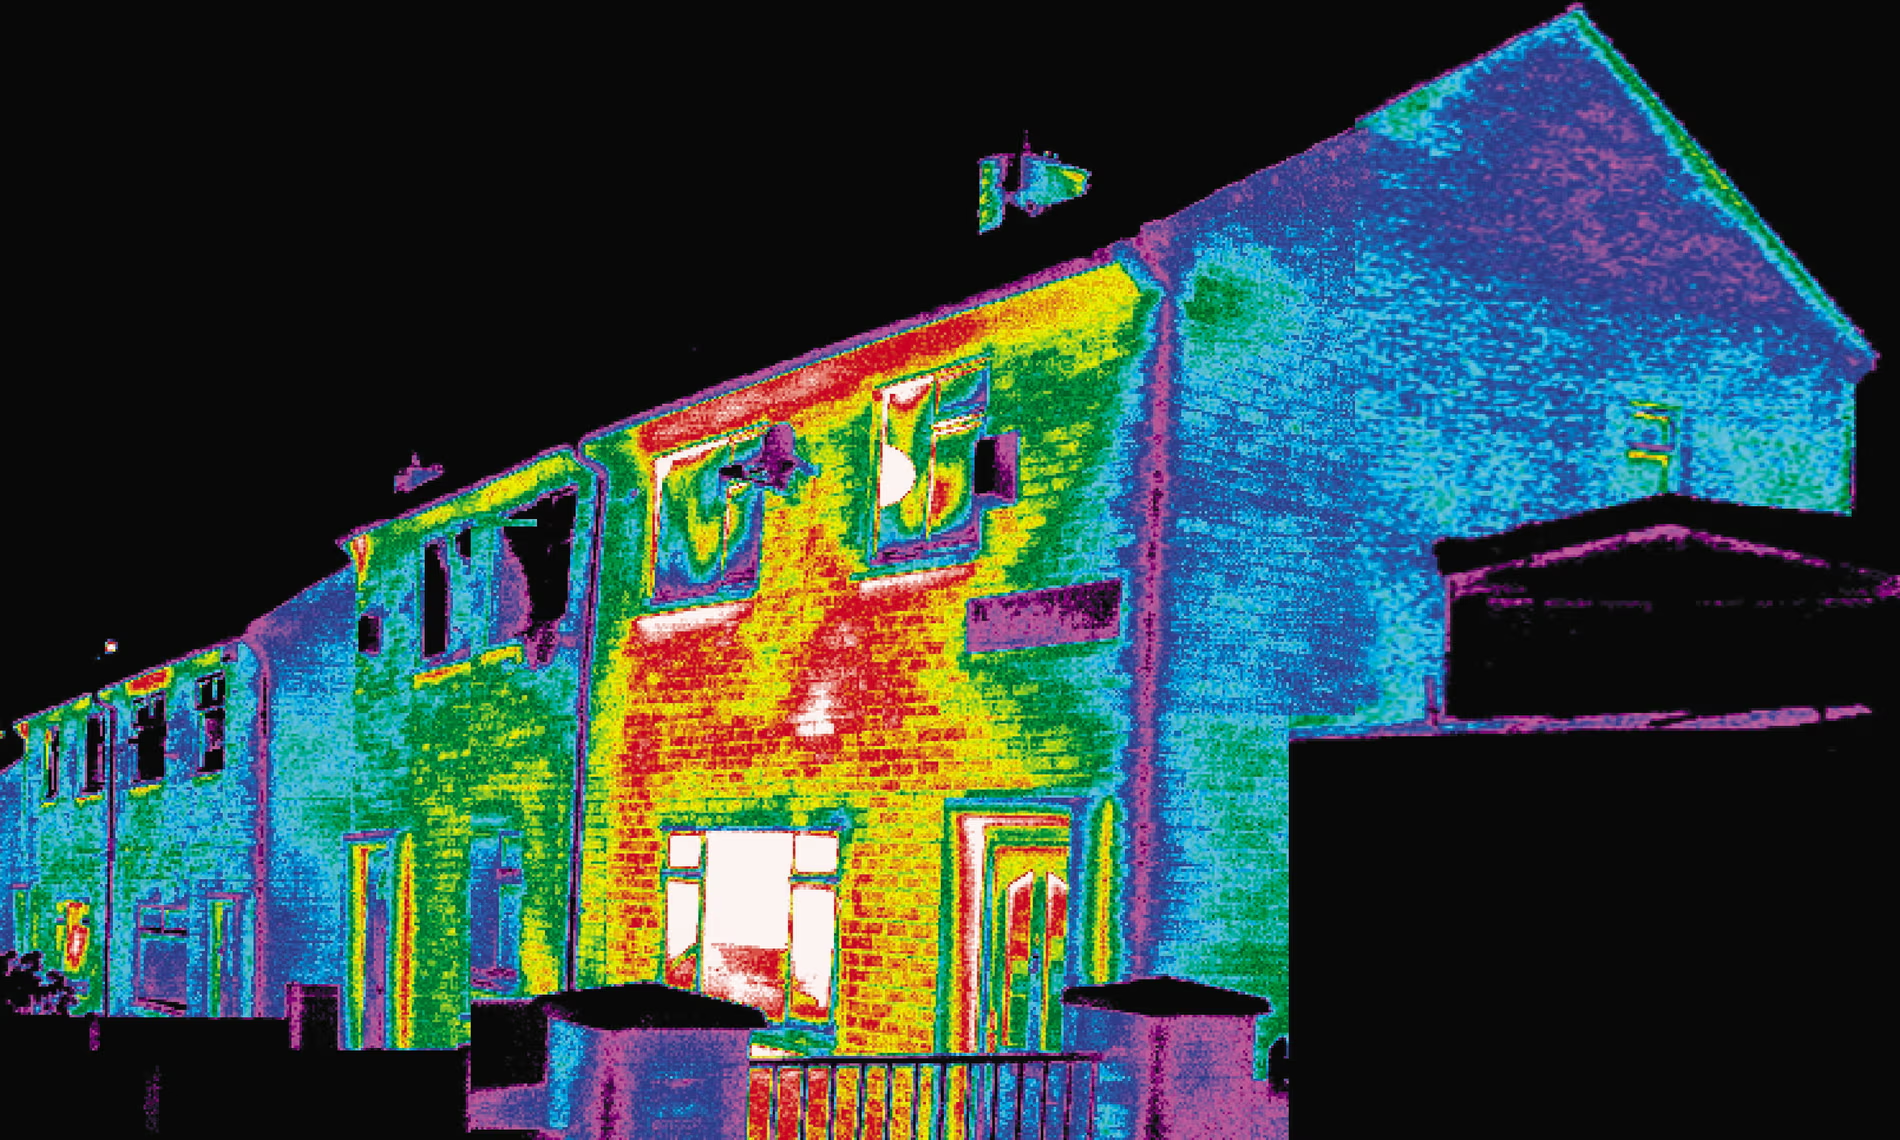
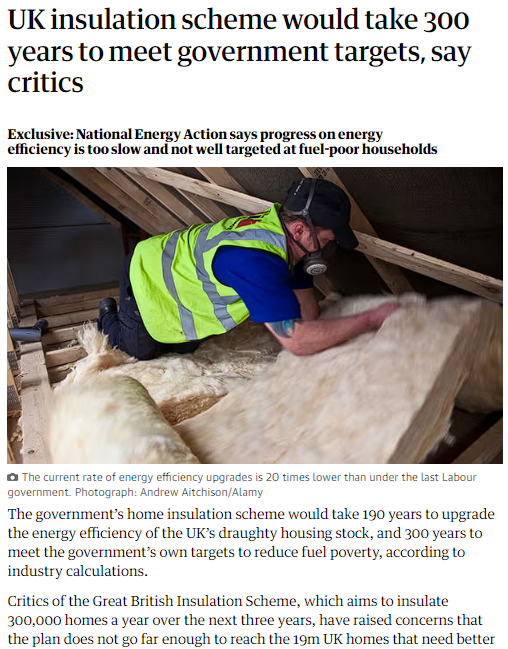
Leaky Homes
National Housing Federation Report (2021):
- gas central heating + poor insulation the norm in UK
The average family or household in England is currently producing more CO2 every year by just living in their home than they are by driving their car!
60% of homeowners don’t think their home energy use has much of an impact on carbon emissions.
28% have no plans to make “eco-upgrades” to their homes in the next ten years.
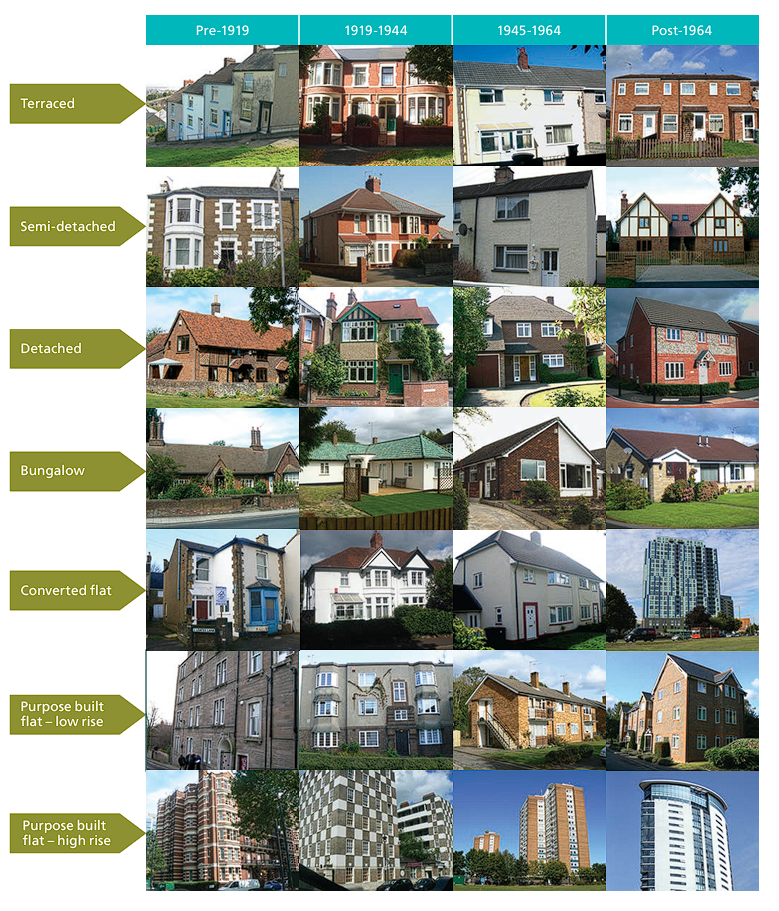
The UK Housing Stock
- Diverse stock morphology -> but most of it is OLD
- 78% built before 1980 (EU - 61%)
- 38% built before 1946 (EU - 18%)
- Insulation standards a recent innovation - older stock more poorly insulated
- No national programme of retrofitting to improve old stock
- Rates of stock improvement are slow
- 2012 - 55% of homes in England had good or very good roof insulation
- 2022 - 57% of homes in England had good or very good roof insulation
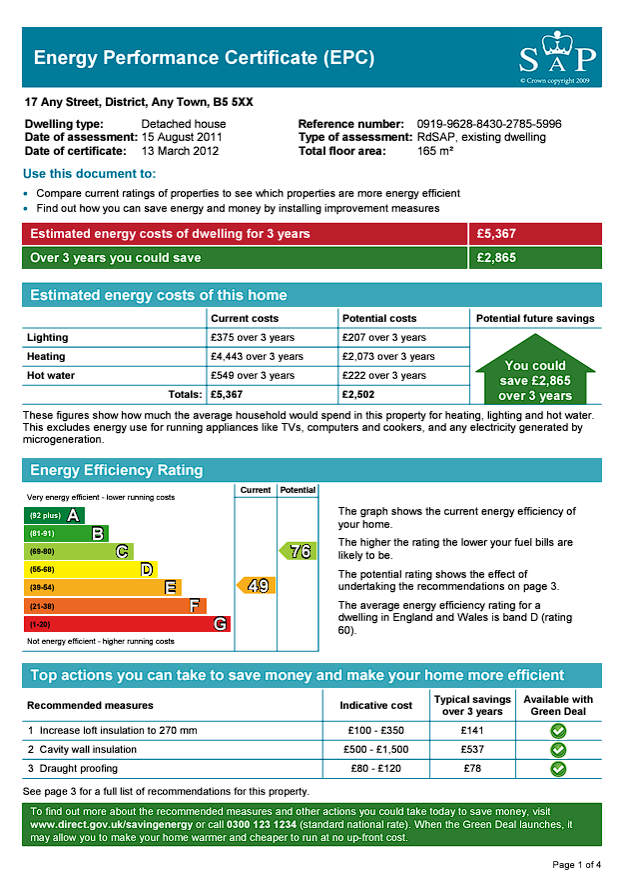
How do we know how leaky our homes are?
- Energy Performance Certificates were introduced in England and Wales in August 2007 (common across most EU countries)
- A valid certificate (they last for 10 years) is now required for any property sold or rented in the UK
- Every property gets a current rating - A to G - alongside a potential rating, which relates to what it could achieve with better insulation, double glazing, etc.
- EPCs are created by surveyors who use something called the ‘Standard Assessment Procedure’ (SAP) to rate the building. SAP accounts for things like:
- Size of building
- Age of Building
- Building materials used
- Glazing
- Heating and hot water type
- Type of lighting
- The SAP is an imperfect science and prone to human error, but it’s the best method currently available
What does the government want?
- 80% of the homes we will be living in in 2050 are already built now, so we need to focus on improving the housing stock we already have
- The Clean Growth Strategy was published in October 2017 and includes several targets to improve energy efficiency:
- to upgrade all fuel poor homes to Energy Performance Certificate (EPC) band C by 2030;
- to upgrade as many homes as possible to EPC band C by 2035
But is this enough and how are they going to achieve it?
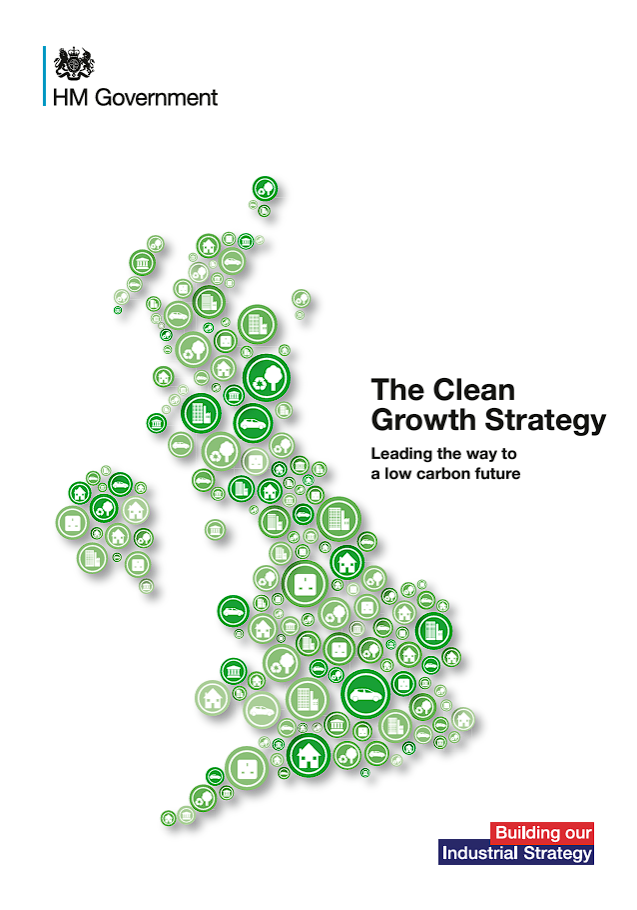
https://www.gov.uk/government/publications/clean-growth-strategy
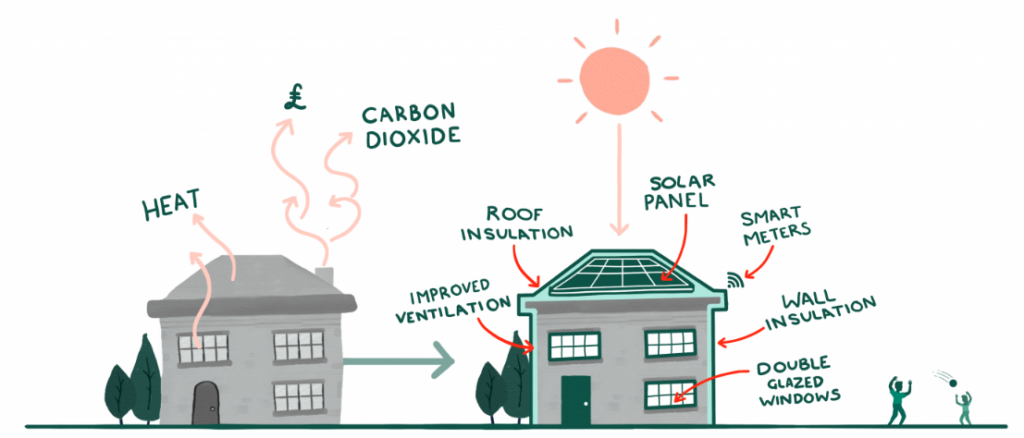
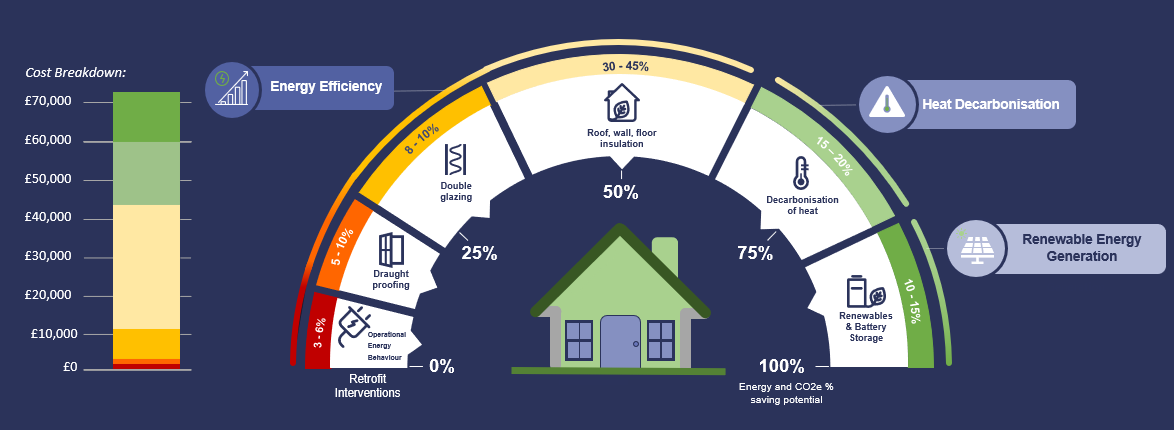
Making homes more energy efficient + additional benefits & challenges
- ‘Retrofitting’ -> process of improving:
- insulation
- ventilation
- air-tightness
- upgrading
- heating (e.g. to heat-pumps)
- lighting (LED bulbs)
- installing smart thermostat and heat control devices
- installing solar panels
- Any one could improve energy efficiency, but doing all at once is known as ‘Deep Retrofit.’
Making homes more energy efficient + additional benefits & challenges
- Retrofitting has other benefits:
- Health - The Building Research Establishment estimates that poor housing costs the NHS £1.4bn per year in additional treatments, with excess cold causing the most problems.
- Jobs - National retrofit programme could create thousands of jobs, benefiting the wider economy;
- Energy security - making us less reliant on imported fossil gas for heating
- But, retrofitting is expensive (up-front cost) - recent estimates are that the average cost of retrofitting a property to Grade C or above would cost £35,000 - even basic insulation costs can run into many thousands of pounds.
- Saving money on heating will eventually make this money back, but it could take many years
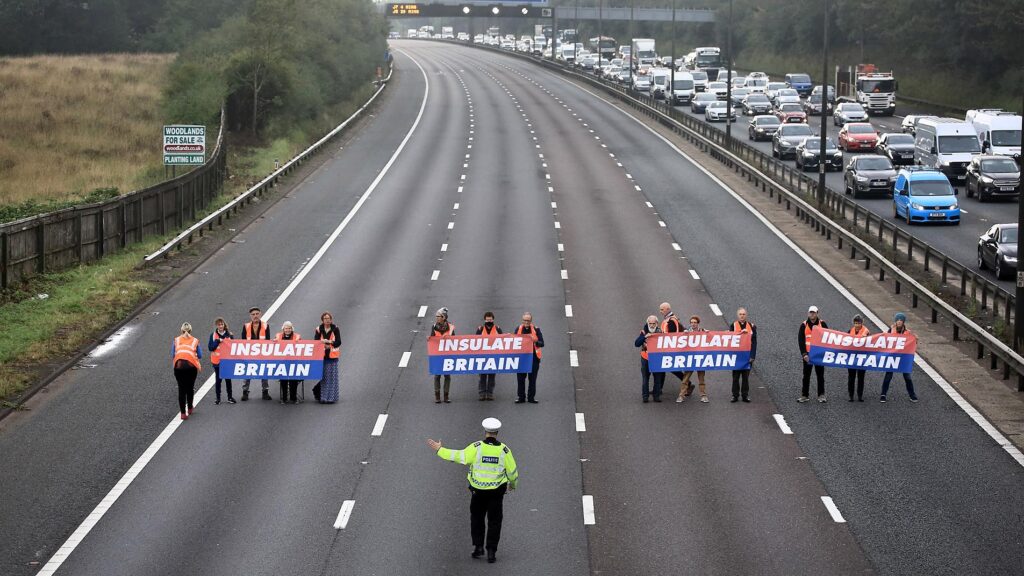
What needs to be done?
- Insulate Britain - pressure group - Estimates that 1.5 homes per minute need to be retrofitted up until 2050 to hit our legally-binding net-zero target - something that we are currently far from achieving.
- Route retrofit unclear for many people (where should I start, who can do it for me?)
- In other countries such as Ireland government recommends suppliers, installers etc. - no similar scheme in UK
- Insulate Britain highlights that UK government currently doesn’t have a long-term strategy or funding mechanism in place to upgrade/retrofit homes to meet our climate commitments
- Incentives such as direct funding (grants) or tax breaks could help - none in the pipeline
How can we get there?
Understanding the various dimensions (scale, location, social etc.) of the housing energy efficiency challenge is crucial to effective strategy and planning.
- Which housing / owners should be targeted first to accelerate the transition?
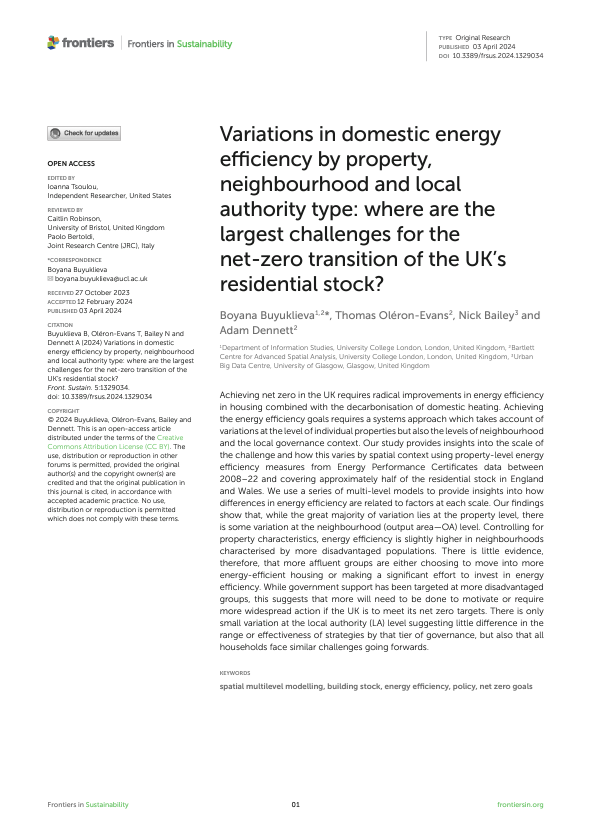
Paper in Frontiers in Sustainability (and related working paper) a first effort to define the parameters of the problem and explain the variance in energy performance across the UK.
- How much variation in energy performance can be attributed to factors at the property, neighbourhood and local authority levels?
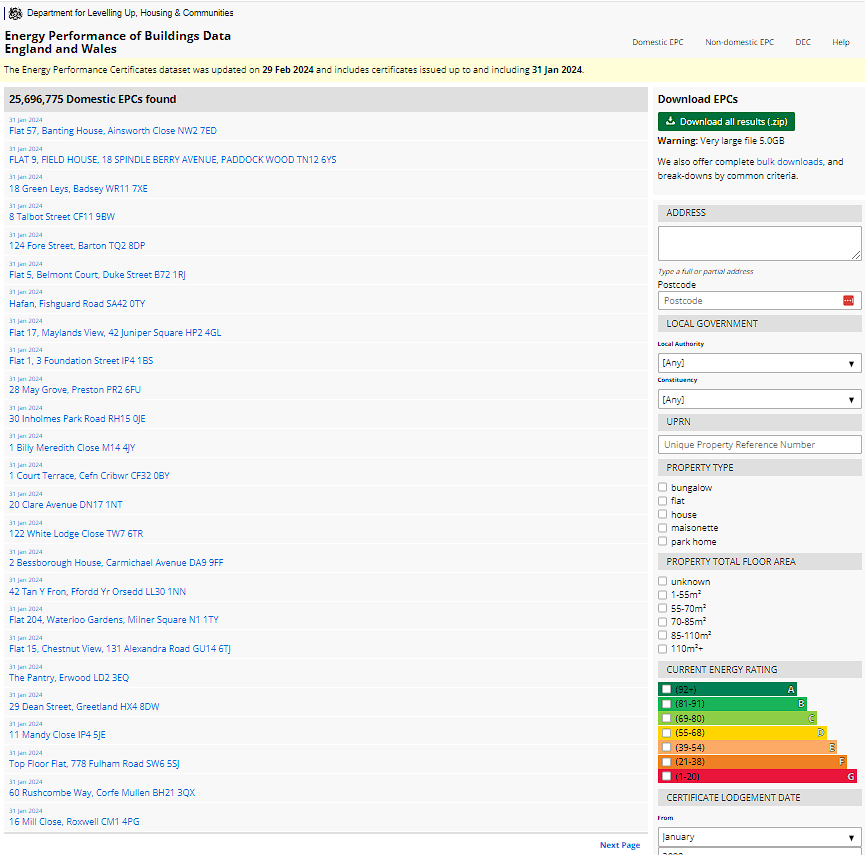
Analysing Spatial Data on Domestic Energy Performance
The Department for Levelling Up, Housing and Communities (DLUHC) collects and maintains data on every Energy Performance Certificate issued in England and Wales. The database is available as Open Data for anyone to explore and analyse.
EPC dataset (Version 10)
25 million records (some repeat entries - new certificates issued for same property etc.)
14 million residential properties in the England and Wales
~50% of total 26.7 million residential properties
Address information varied, but Unique Property Reference Number (UPRN) links to precise map coordinates for each property
Energy Efficiency vs environmental Impact
- Each home has two scores associated with it:
- Energy Efficiency (0-100) - how much energy used - related to running costs
- Environmental Impact (0-100) - level of CO2 emissions associated with energy use (clean electricity much better than buring coal, for same energy output)
- More or less energy efficient / environmentally impactful homes are not spread evenly across the country - some places and some types of neighbourhood are more or less likely to have energy efficient homes
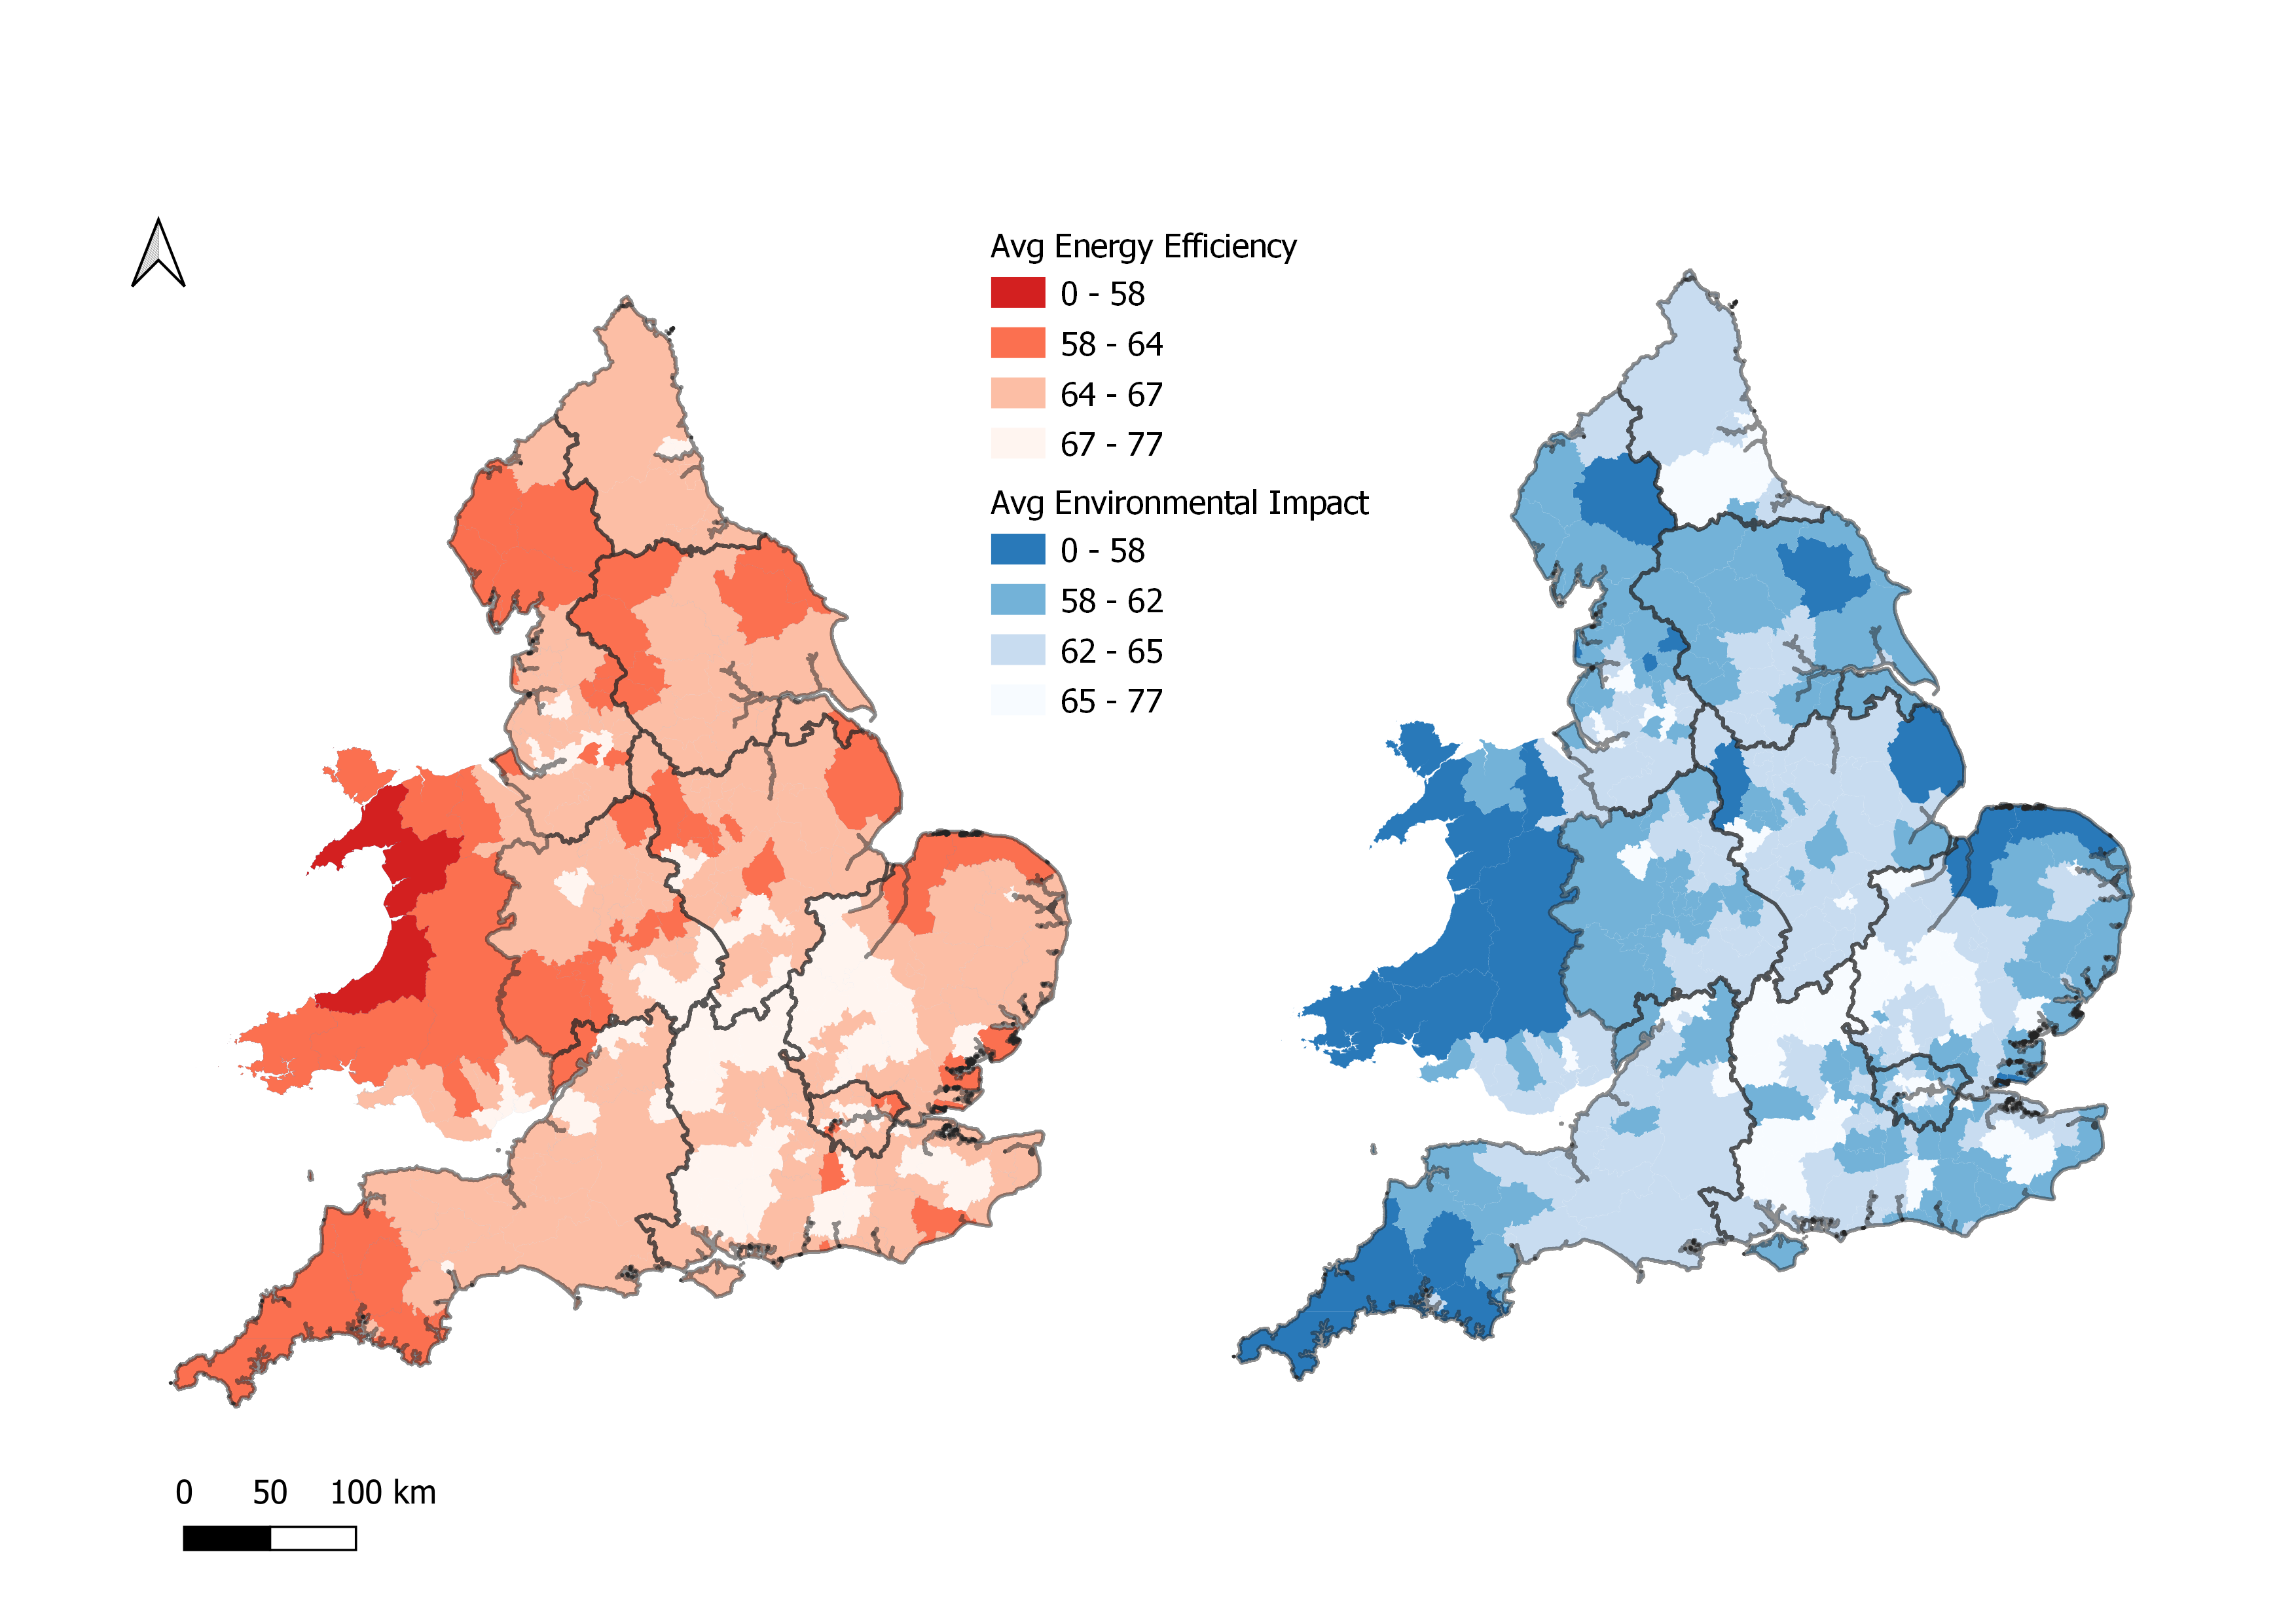
Average Energy Efficiency and Environmental Impact by Local Authority - Source, https://epc.opendatacommunities.org/
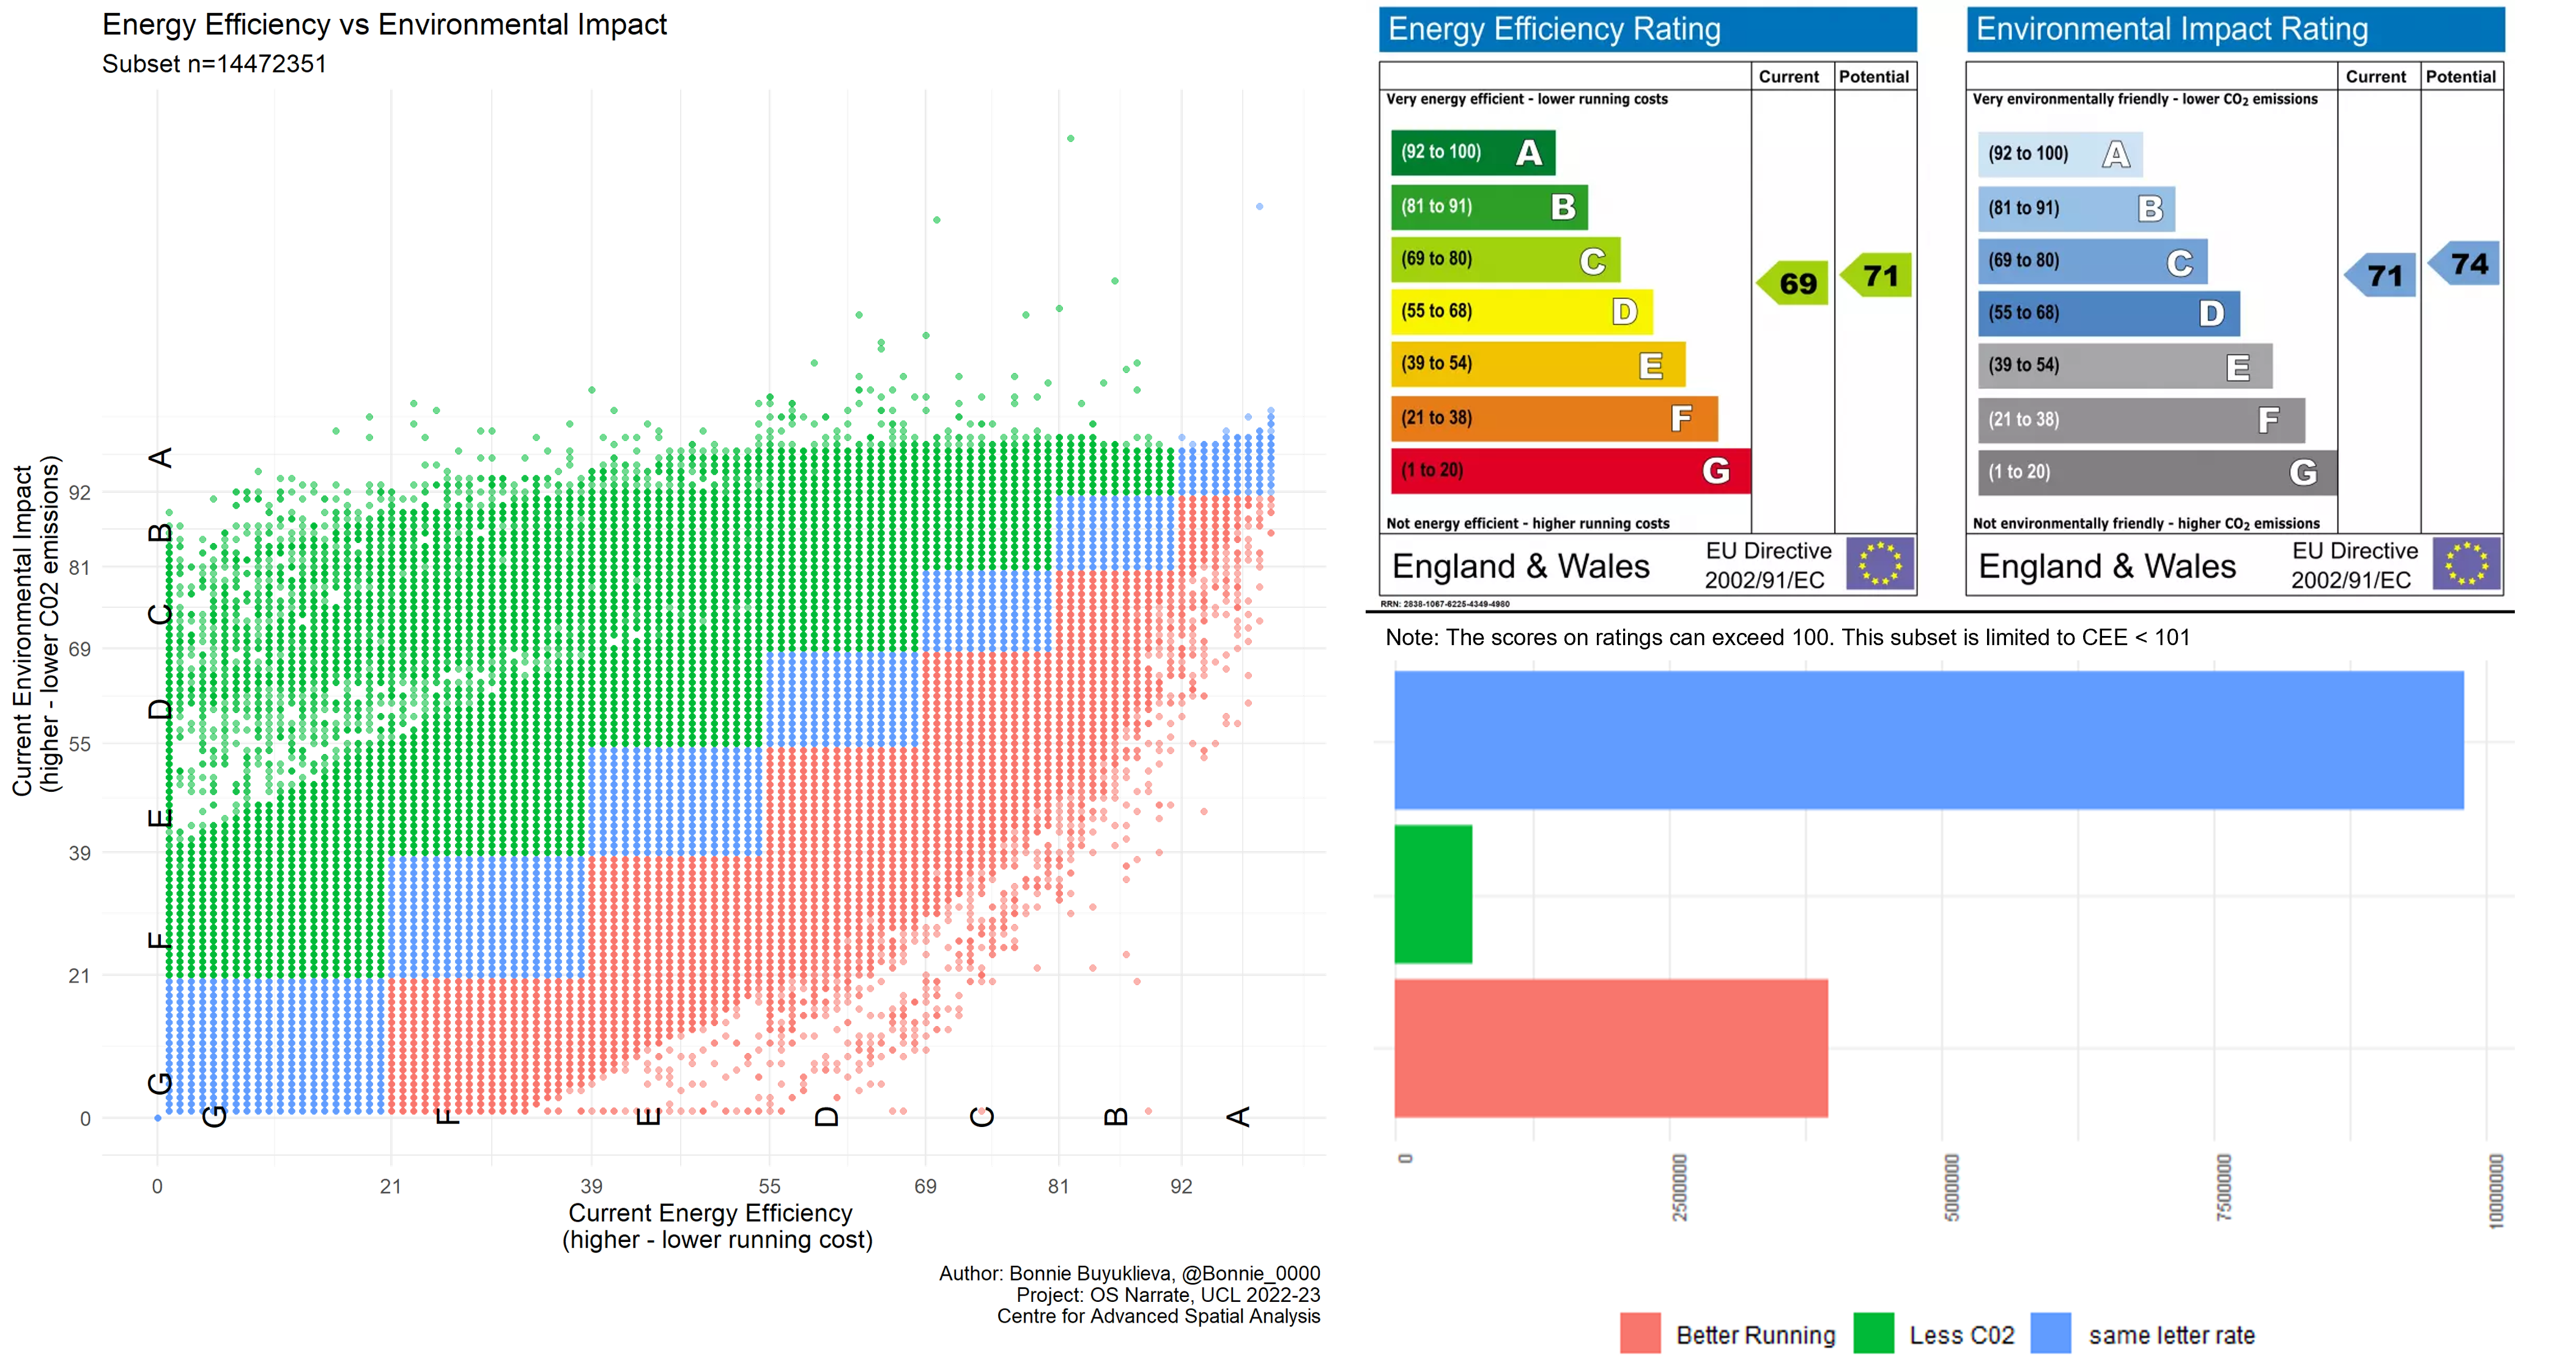
Energy Efficiency vs environmental Impact
- Most properties fall in the same band for efficiency vs impact, however:
- Red = Better Energy Efficiency (e.g. some double glazing, insulation), worse environmental impact (heated by fossil fuels)
- Green = Worse Energy Efficiency (e.g. poor insulation), better environmental impact (heated by electricity)
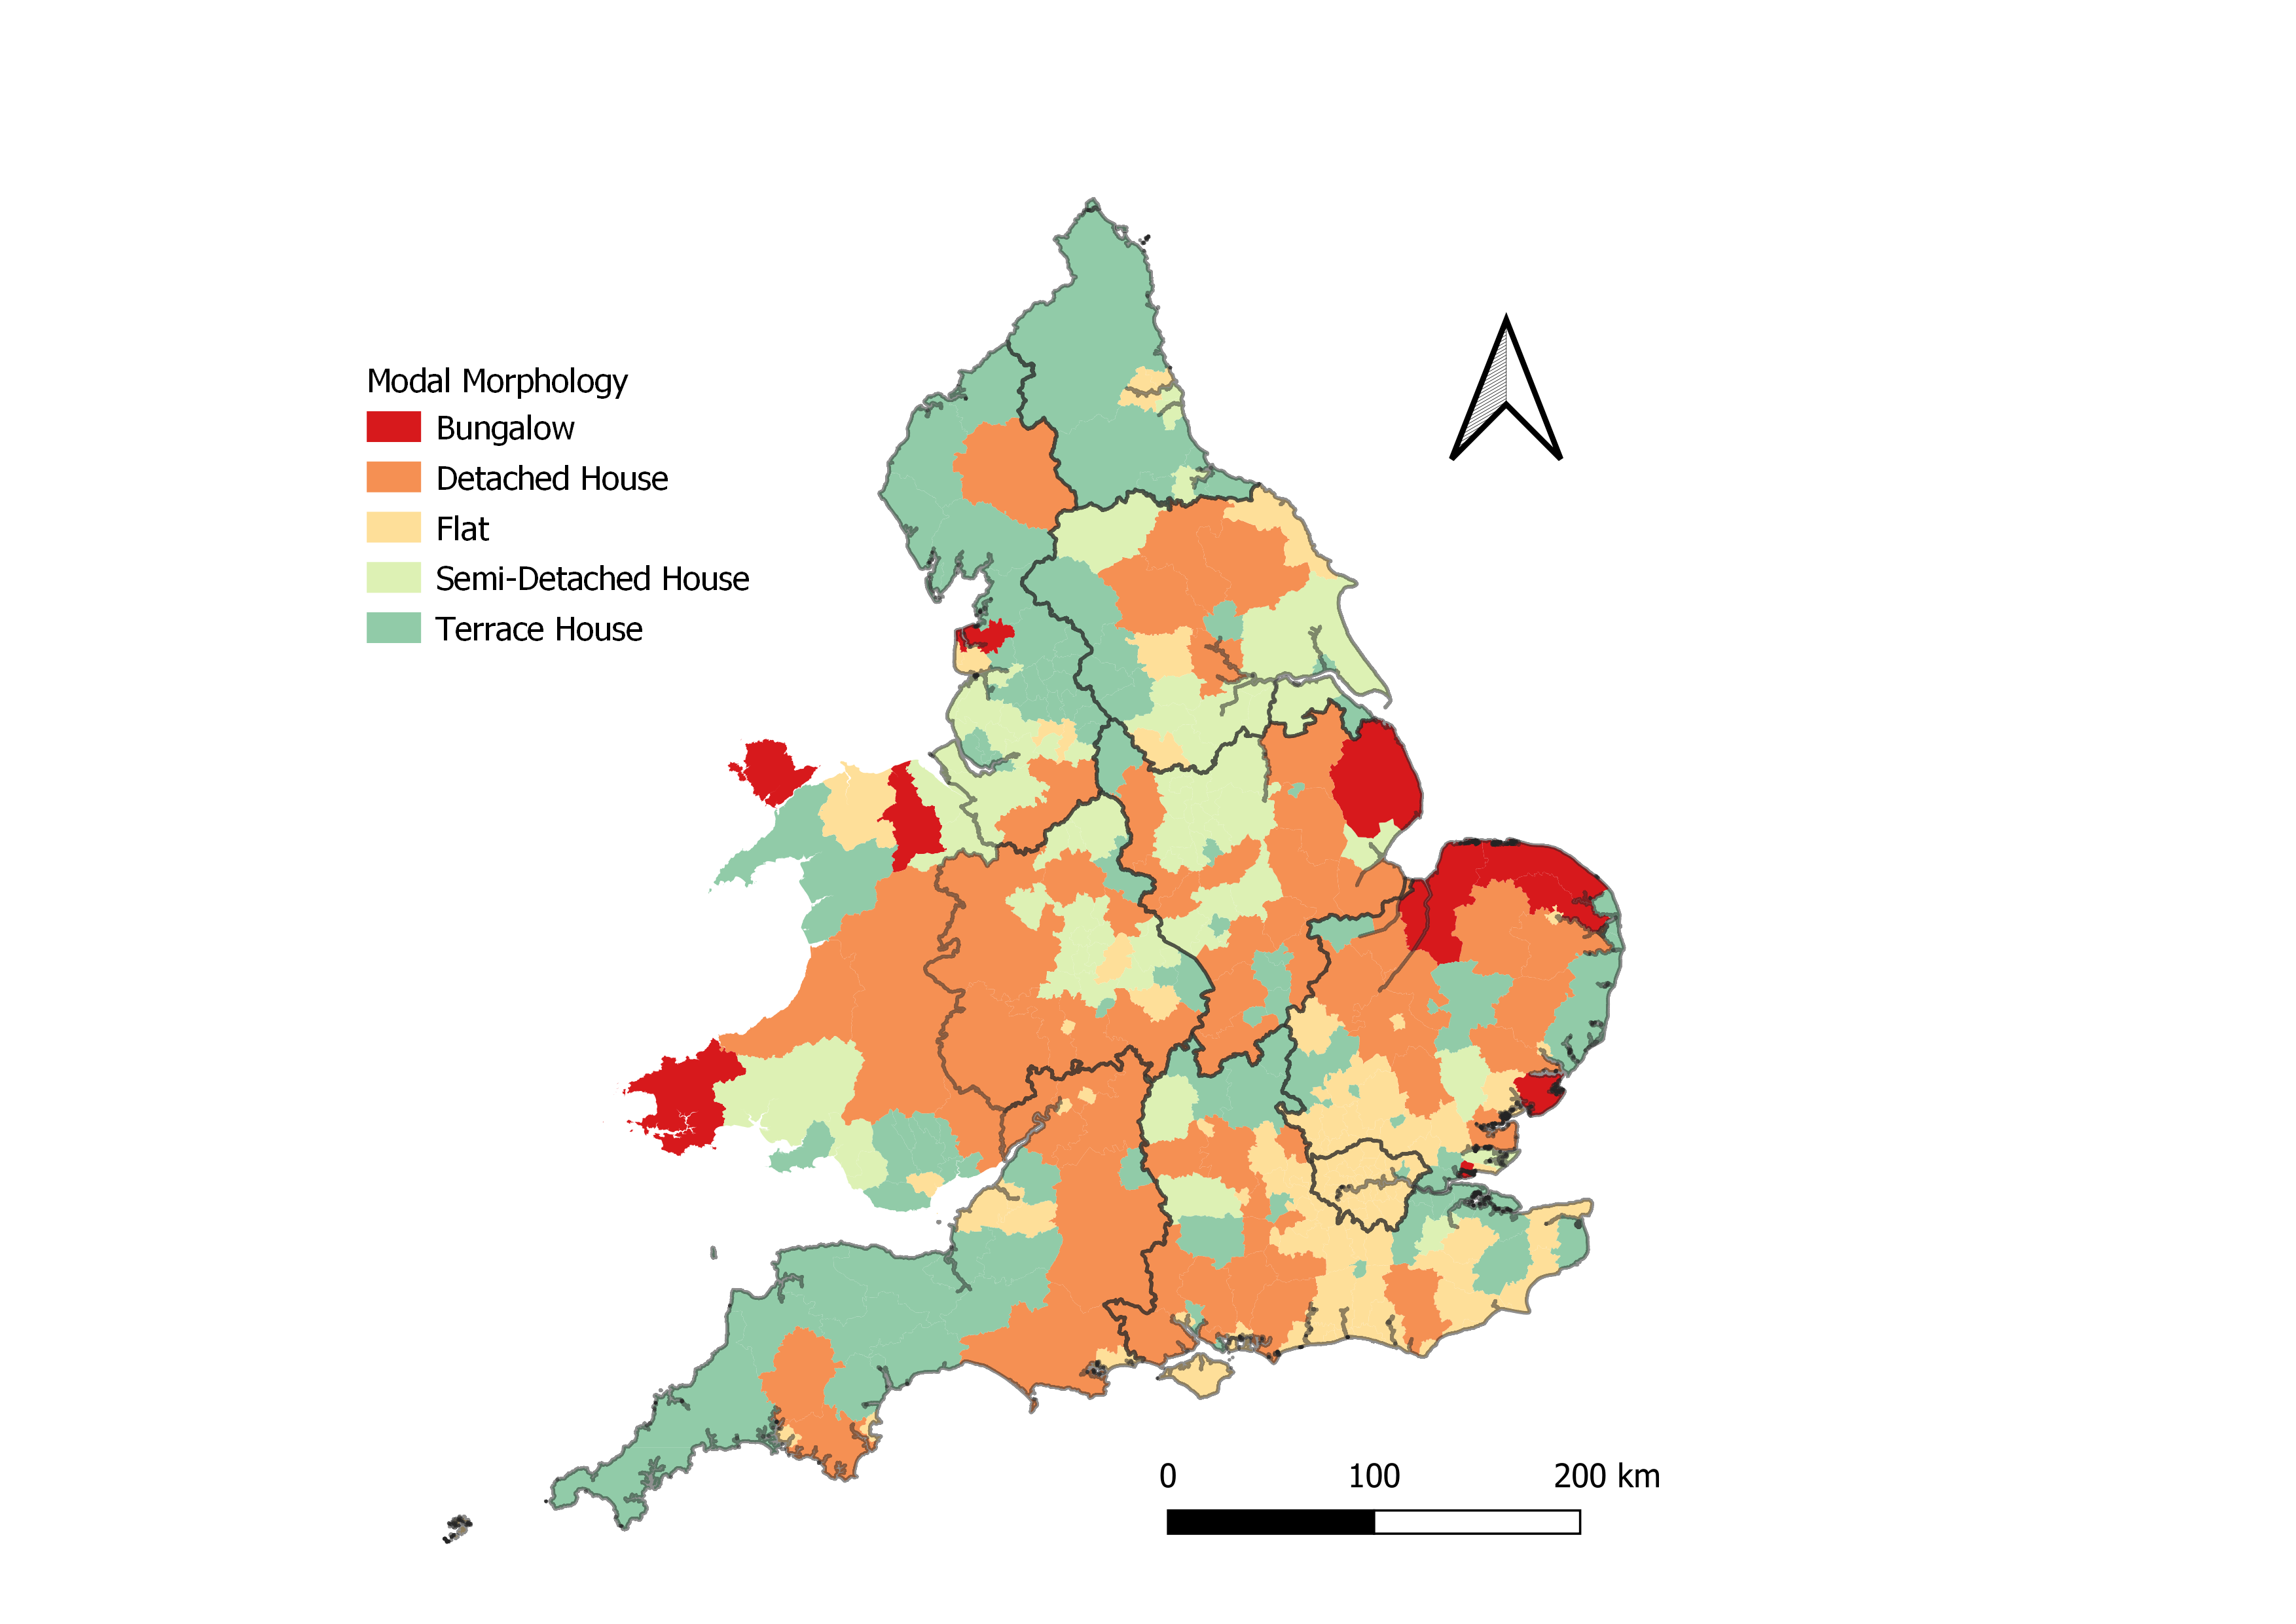
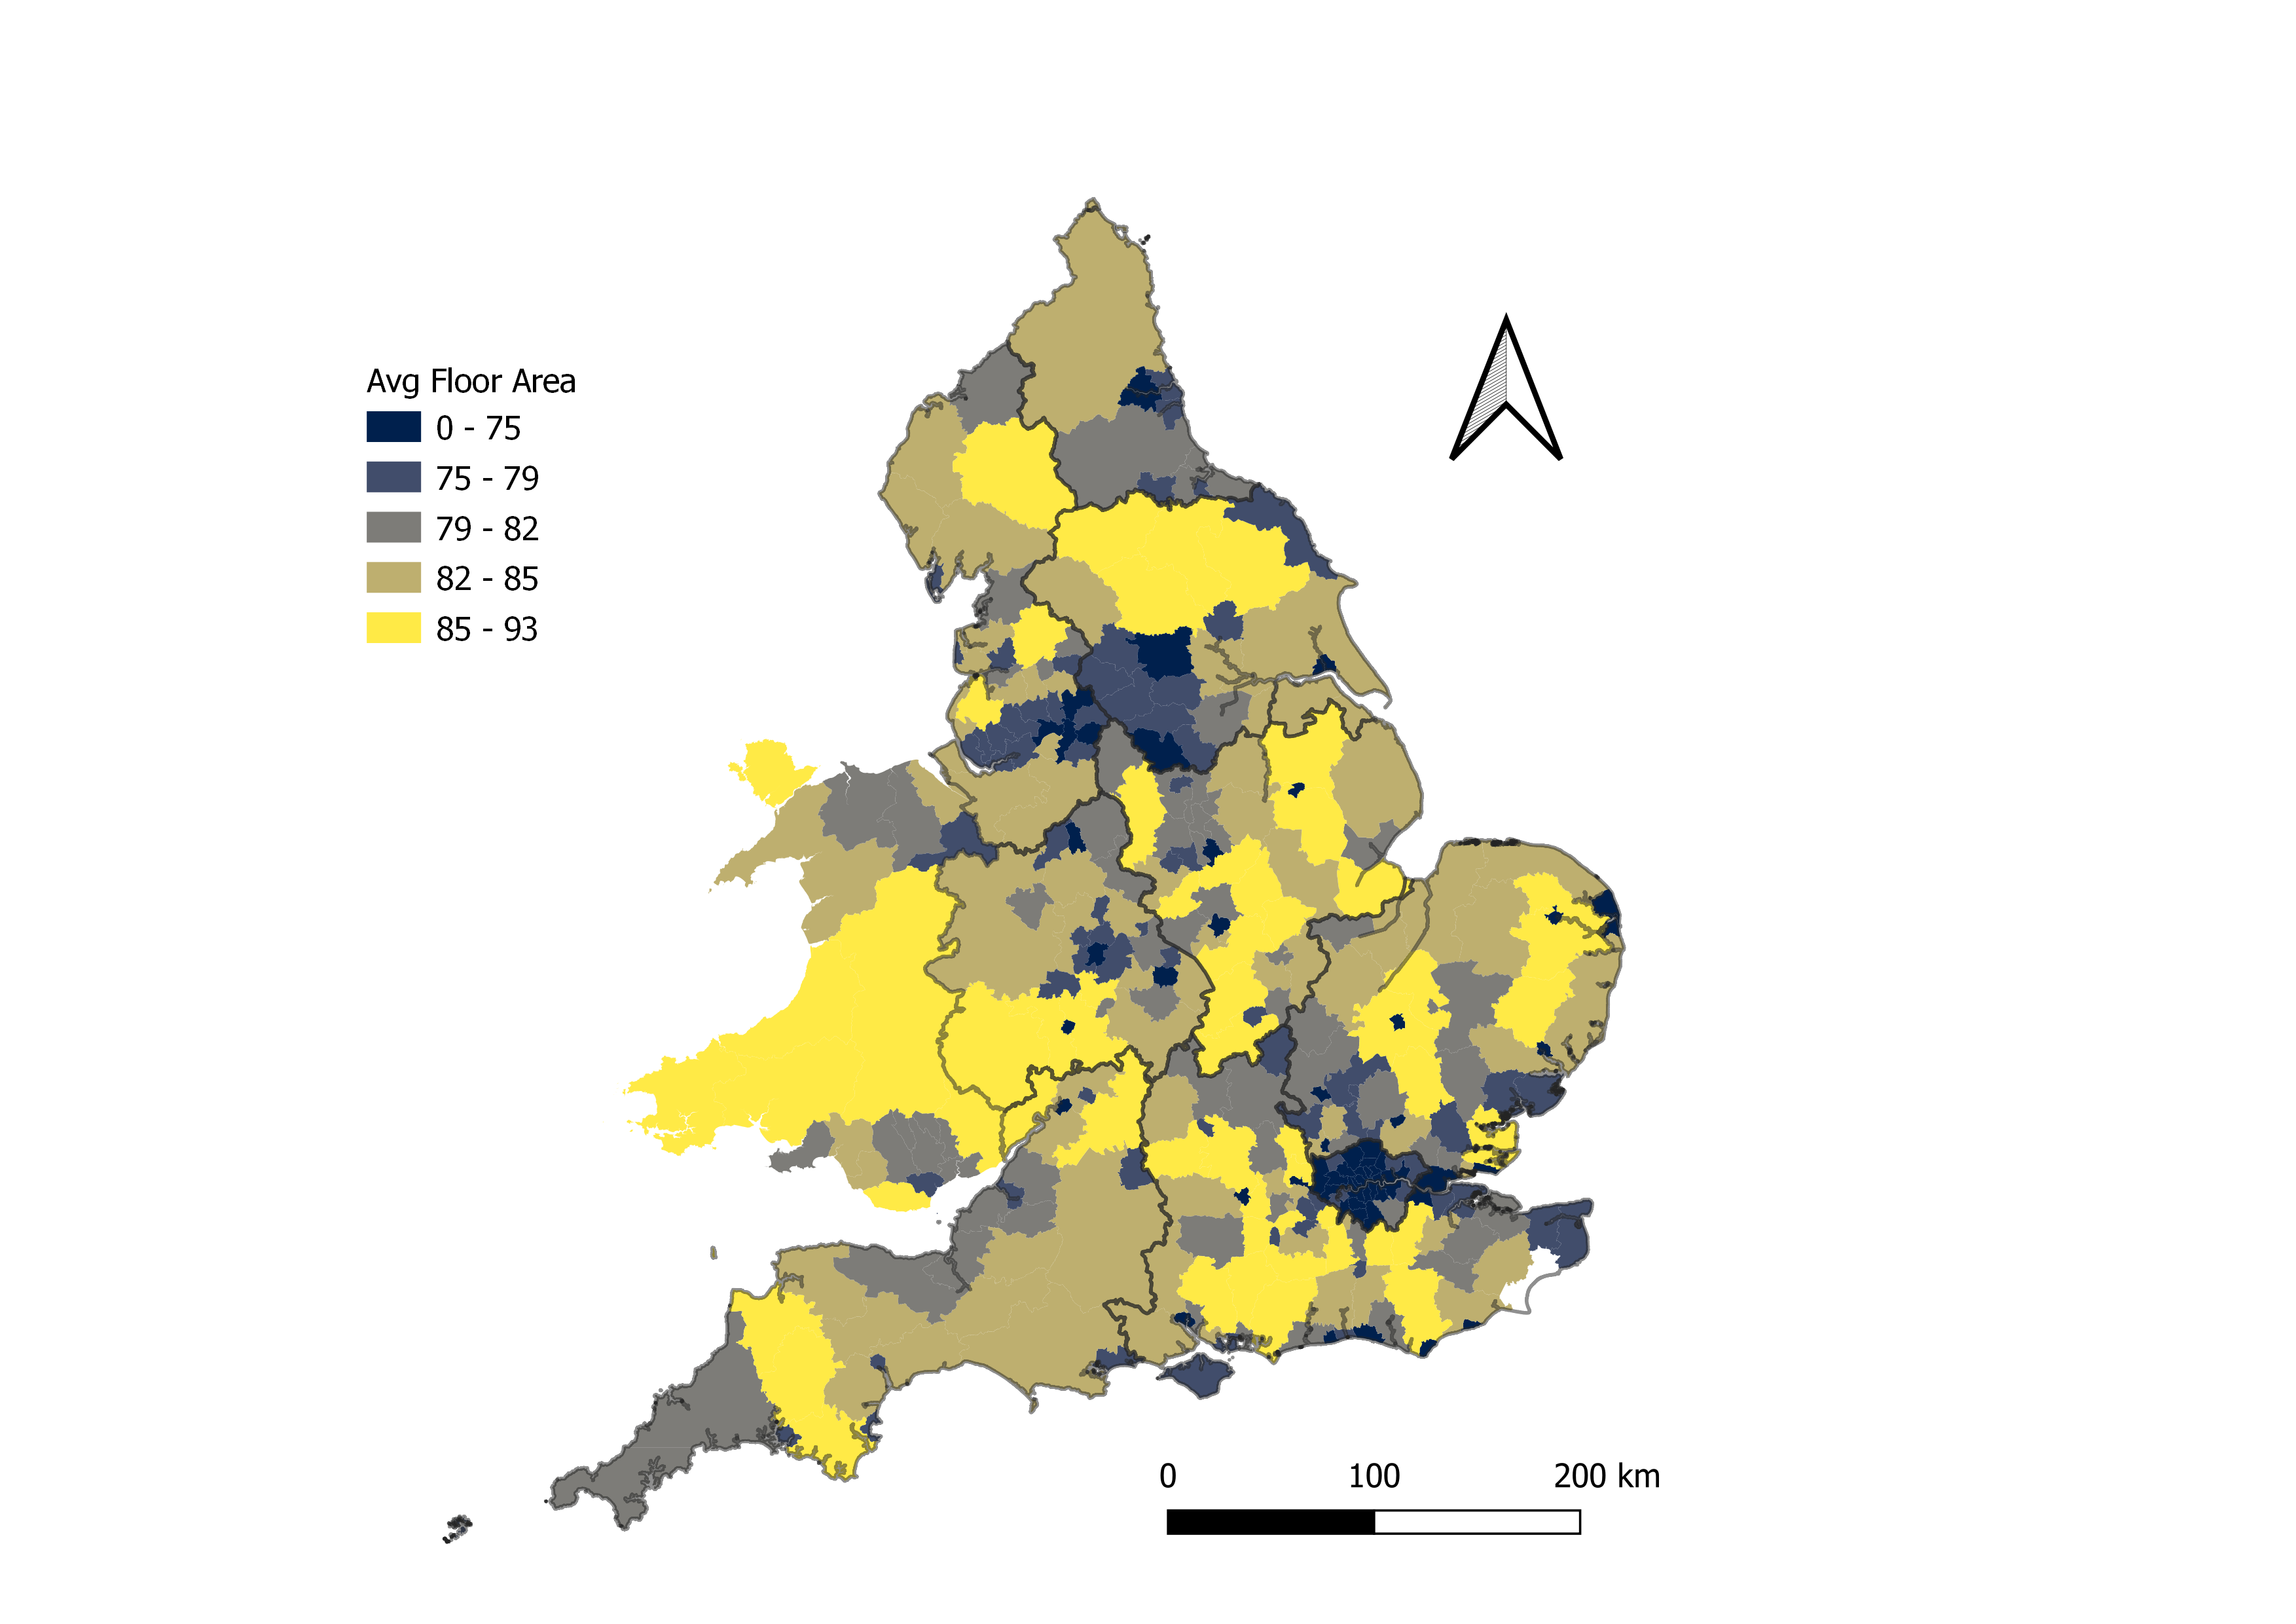
Location
- Spatial variation in most common type (left) and size (right) of property
- Controlling for the type, size, age and other characteristics of a property relative to energy efficiency is important
- Does London just score better for energy efficiency just because it is full of small flats?
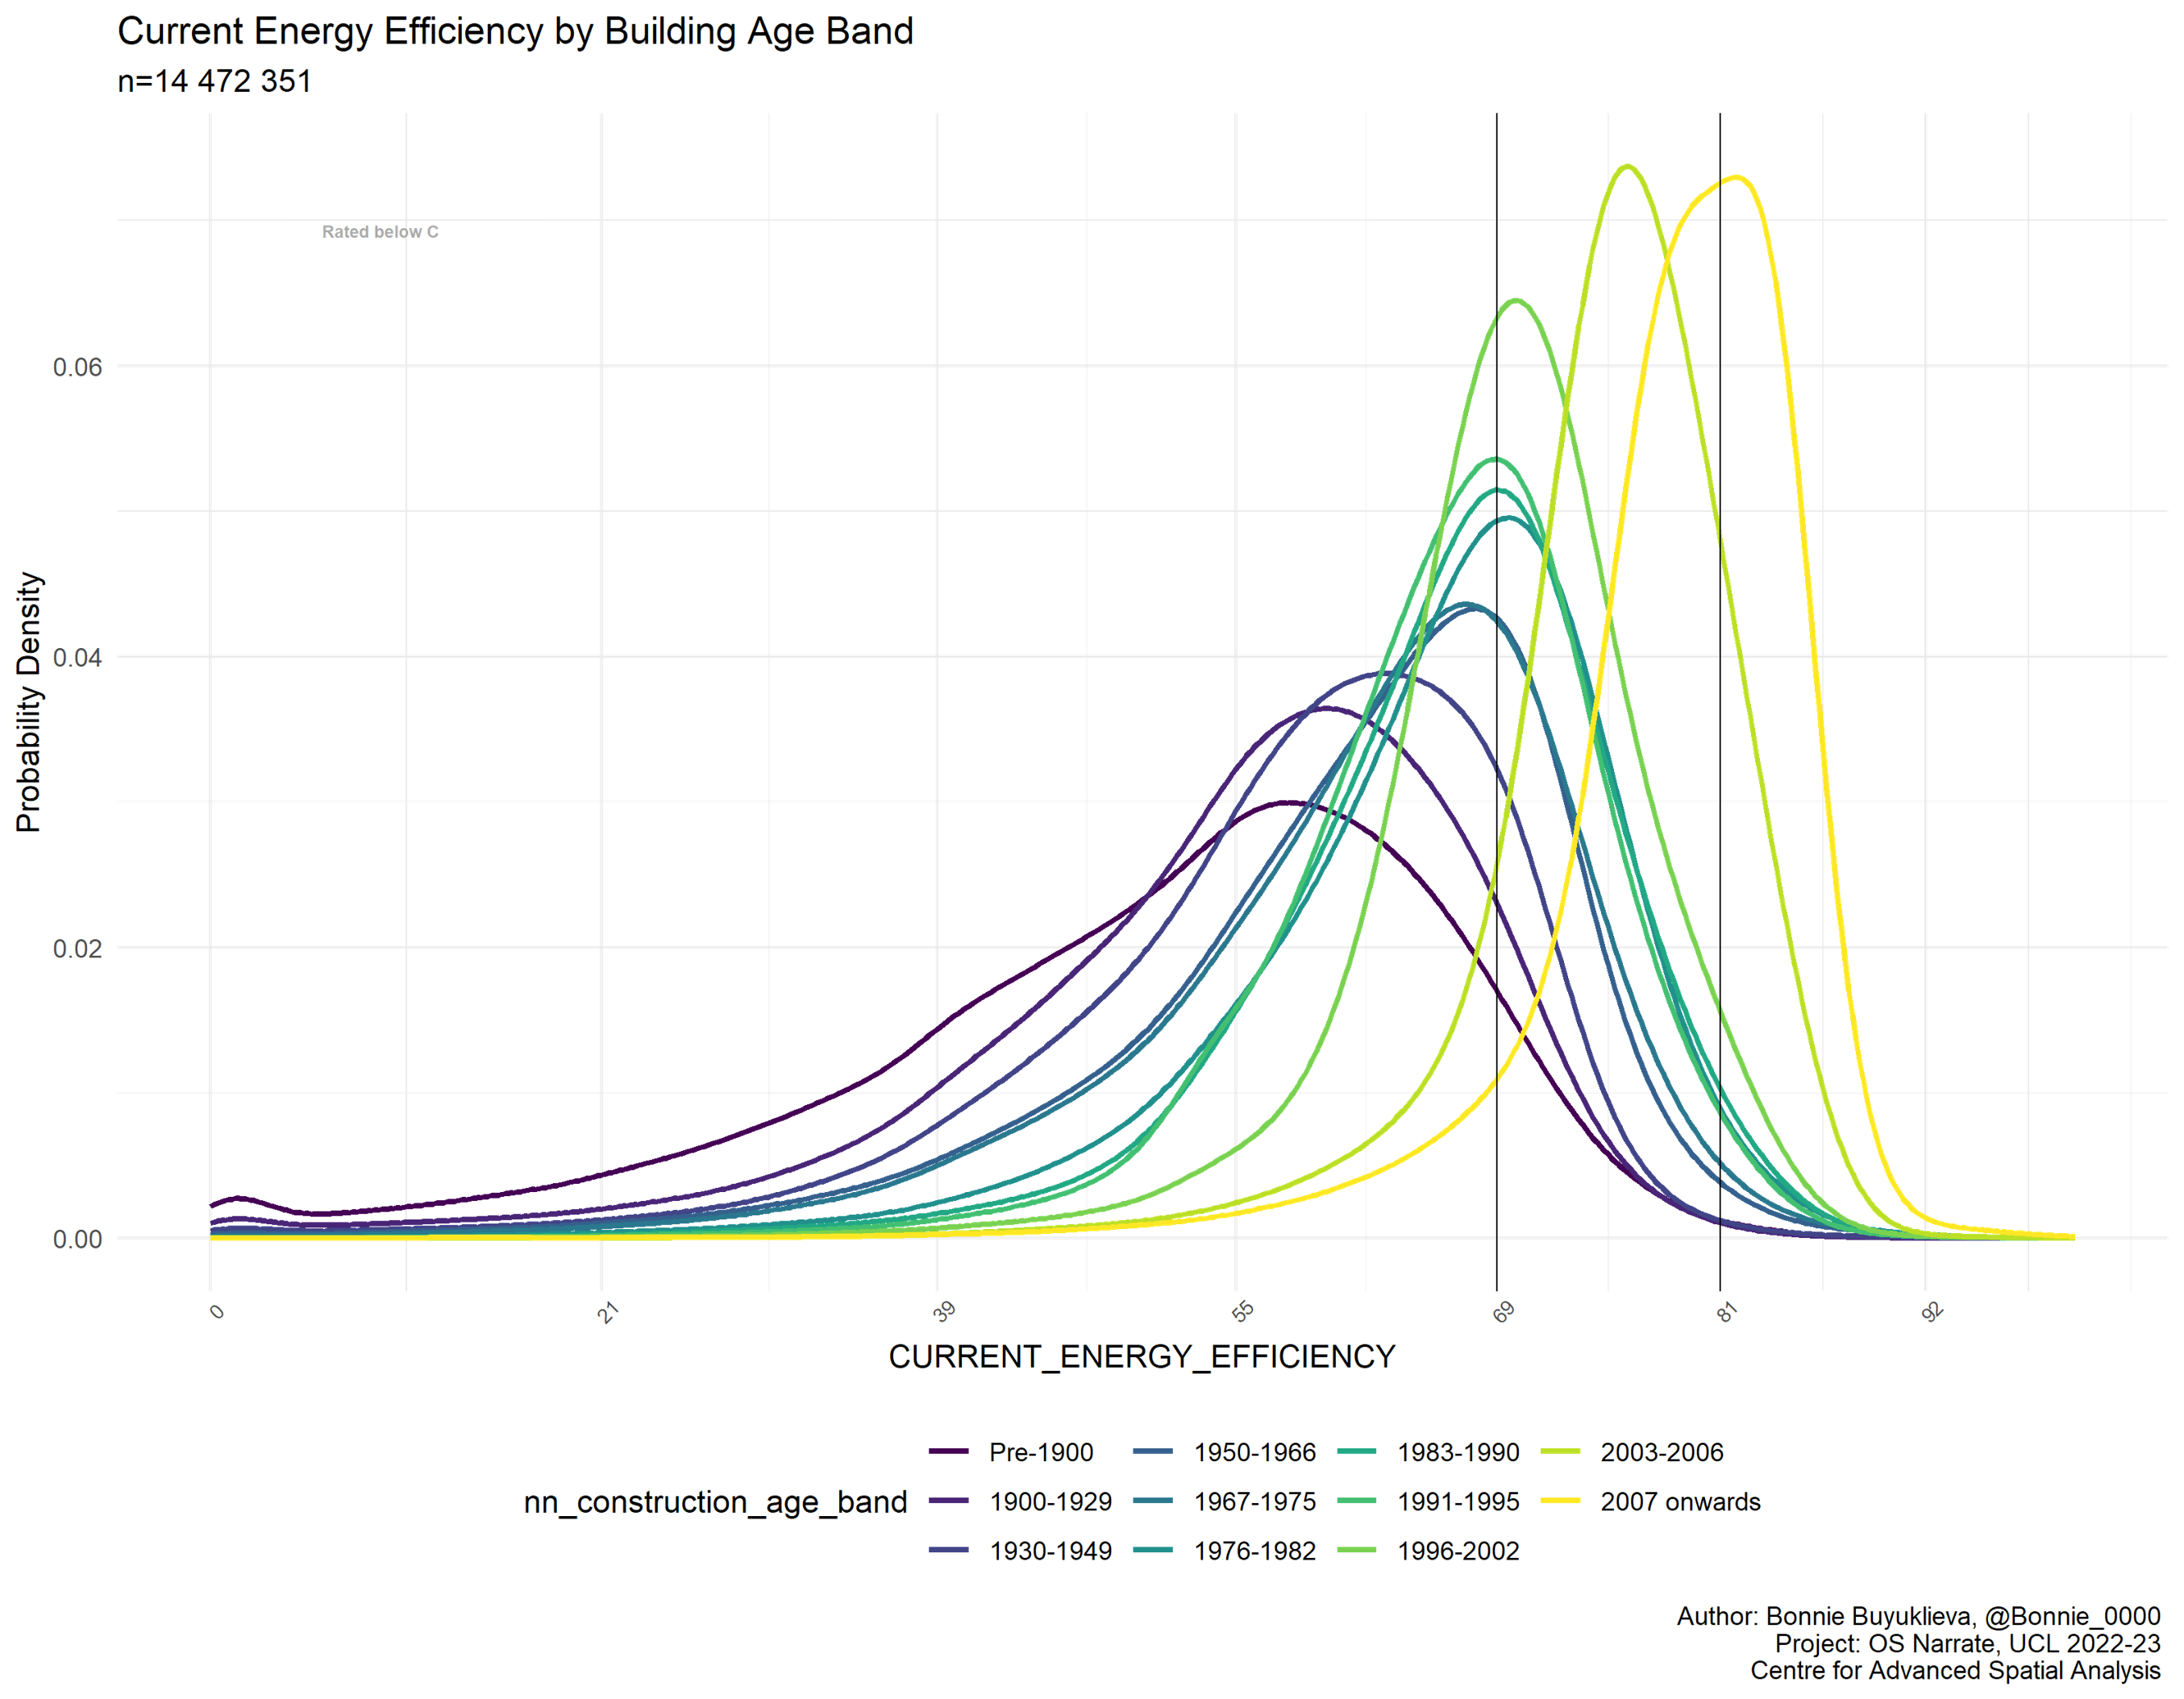
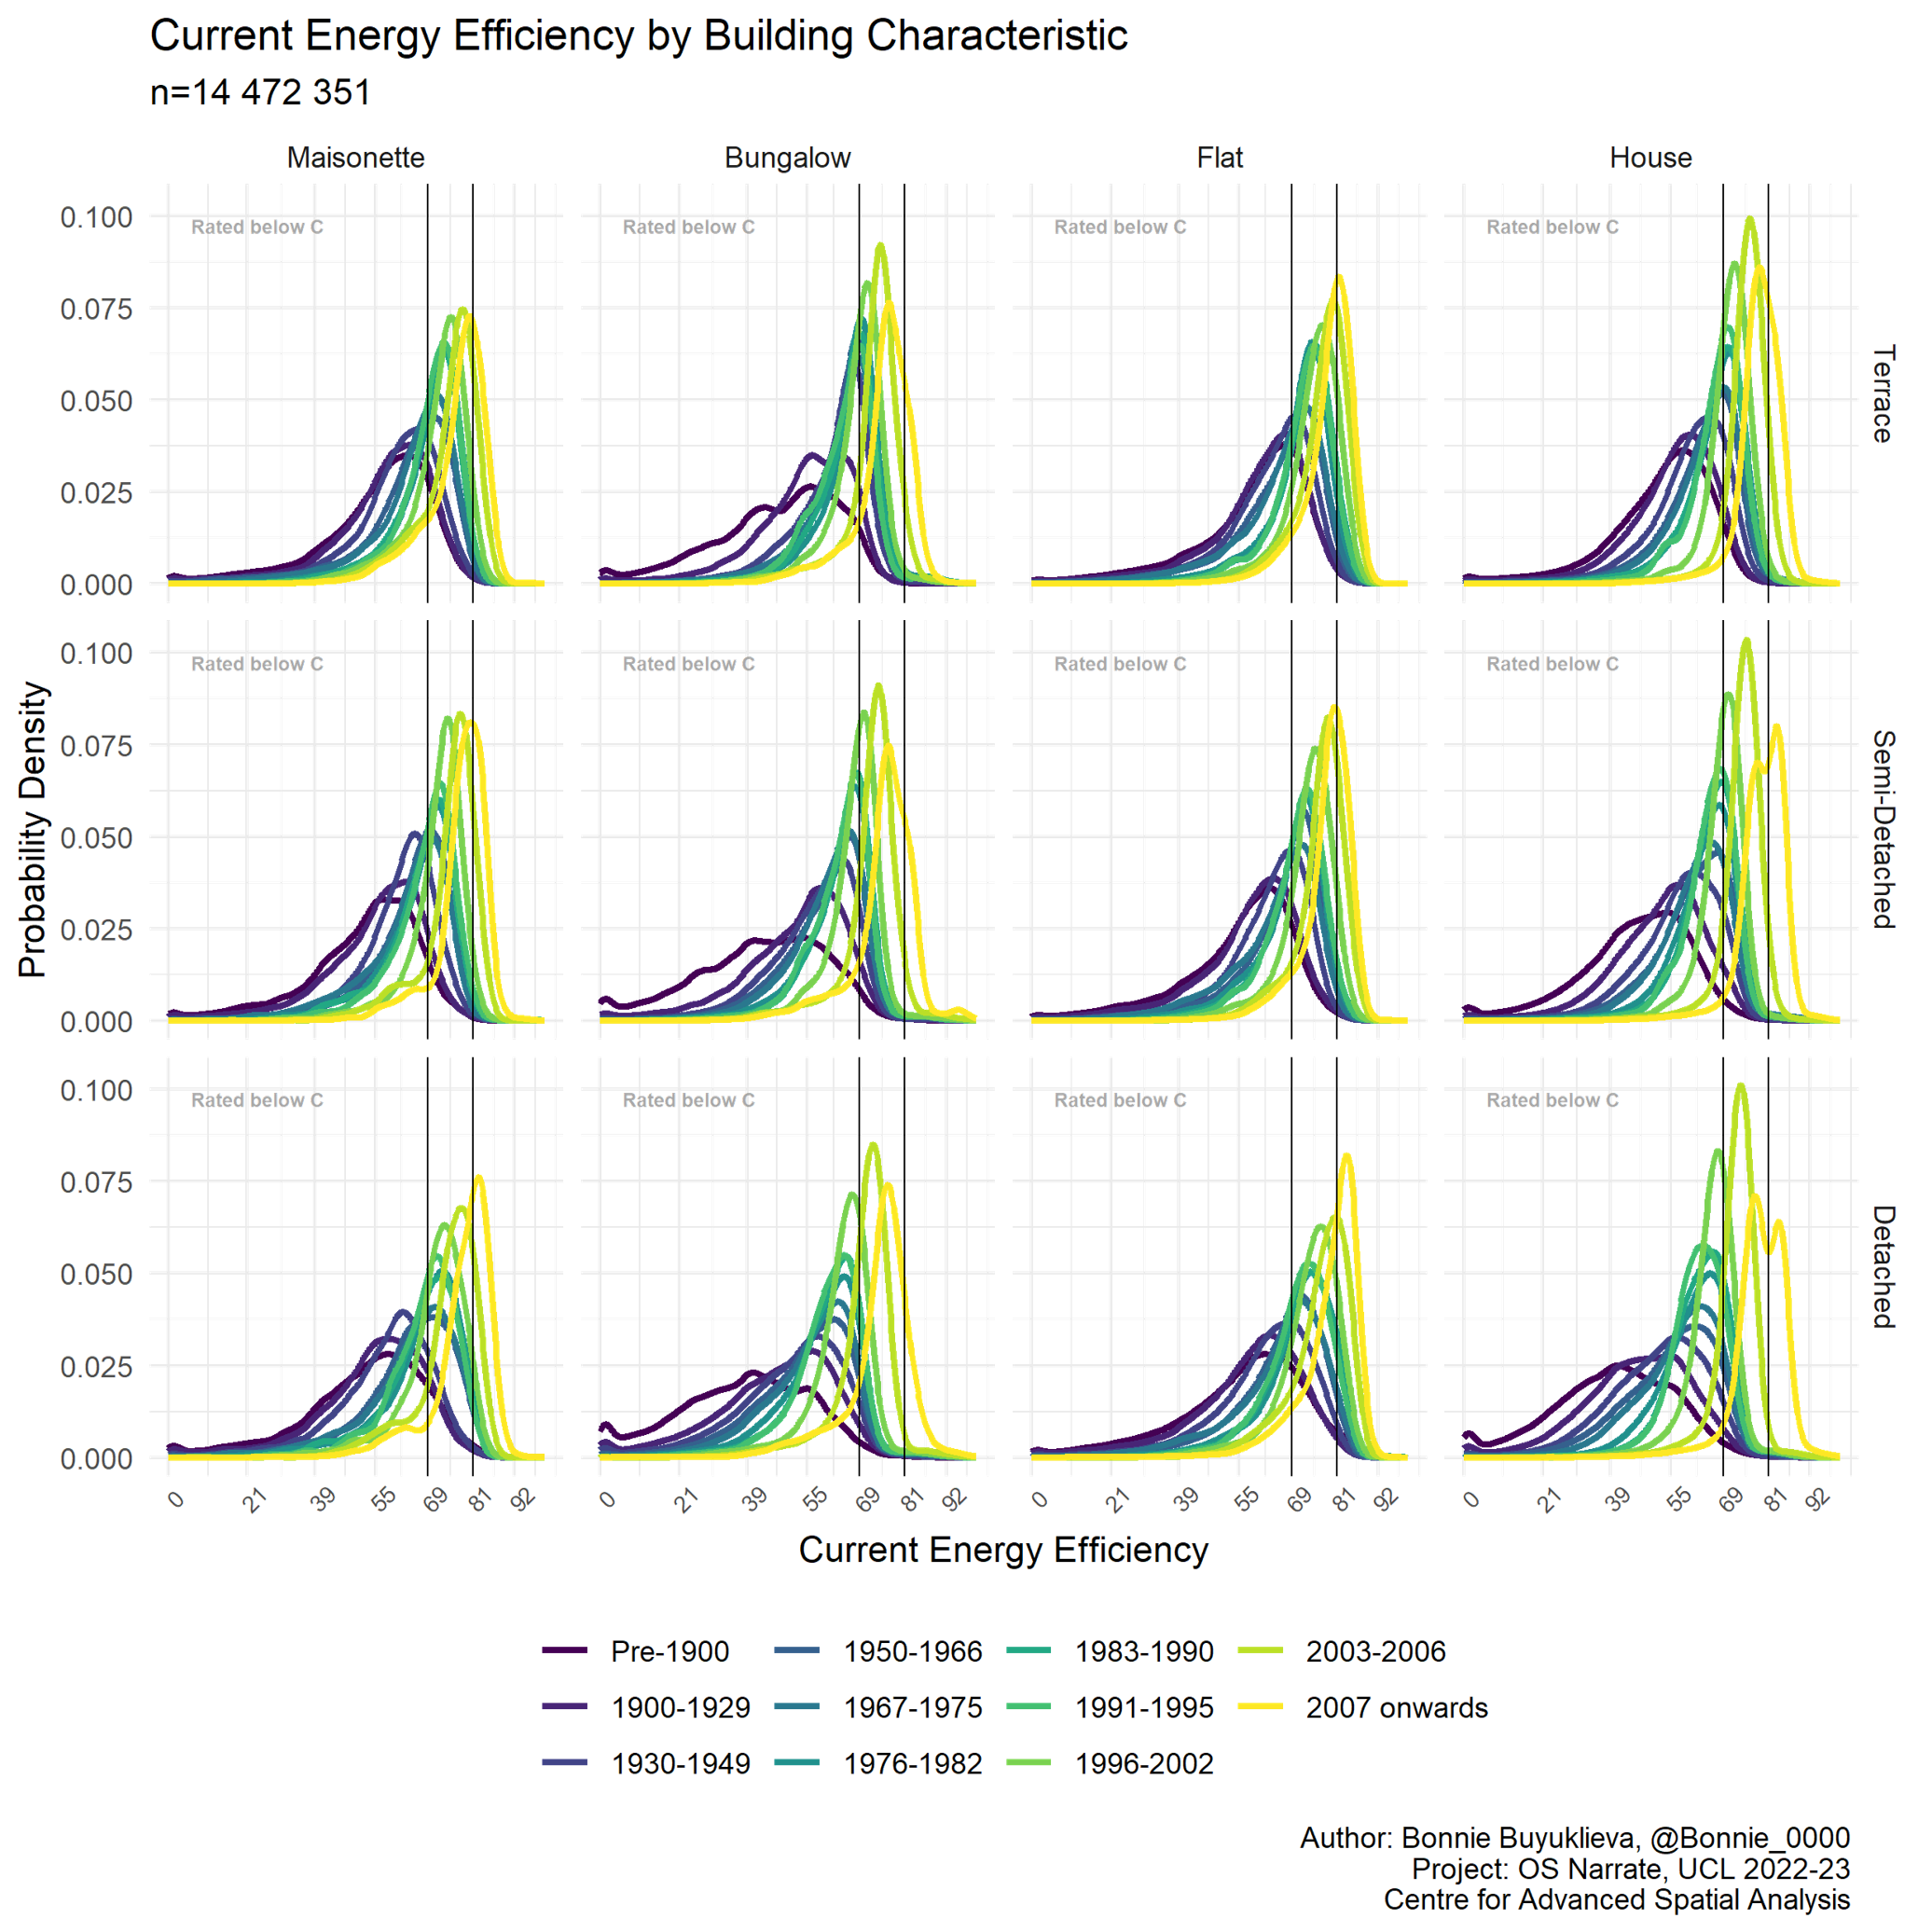
Age
- Energy Efficiency is strongly correlated with the age of the property
- Band C (69 and above) is the government target for efficient homes.
- If your property was built after 2003, you have a very high probability of being band C or higher
- As properties get older the variation in their efficiency gets greater, but the probability of being band C or above gets much lower.
- Any property built before World War II has a high probability of being below band C
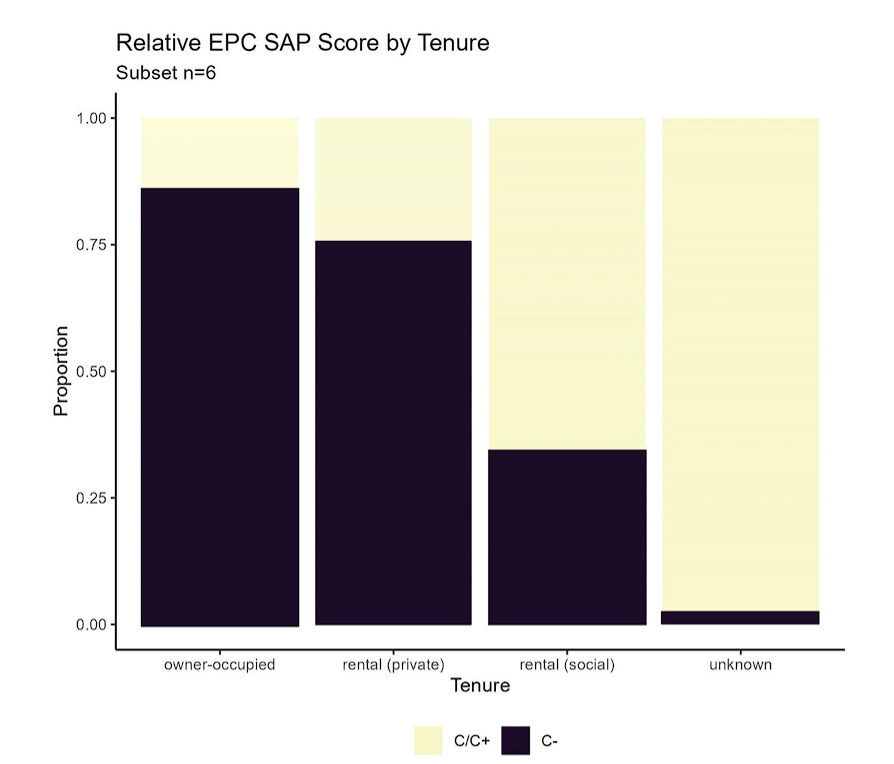
Tenure
- Tenure: Whether the house is owner-occupied, privately rented or socially rented is also very important
- Socially rented housing has far better energy efficiency than all other housing tenures (only 30% worse than band C)
- Various reasons for this:
- social landlords more conscious of the needs of residents, some large retrofit programmes
- social housing more likely to be flats
- Various reasons for this:
- Private Rental housing has a bad reputation for quality and unscrupulous landlords and is bad with around 75% worse than band C
- But Owner Occupied housing is worse still, with less than 20% band C or above.
Property type / Age
- Property type:
- Flat/Maisonette ~1/2 external walls - smallest average floor area
- Terraced ~2 external walls
- Semi-detached ~3 external walls
- Detached ~4+ external walls - largest average floor area
- Older detached housing has the worst energy efficiency
- even some modern detached housing has poor energy efficiency (Bottom Right)
- Terraced flats and maisonettes have the best energy efficiency
- even older properties more likely to be rated C or above than some more modern terraced and semi-detached housing
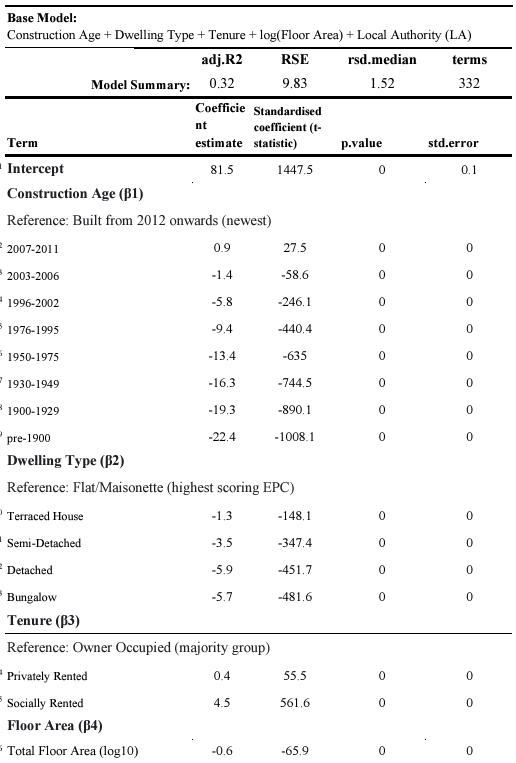
Accounting for Energy Efficiency Variations
- Baseline linear (regression) model - Dependent variable = Energy Efficiency Score ~ building characteristics:
- age
- dwelling type
- tenure
- floor area
- and which Local Authority the property was found in
- Age most significant variable in energy performance
- negative coefficients get larger with age
- Tenure (socially rented large positive coefficient) important
- Dwelling type (bungalow large negative coefficient) also important
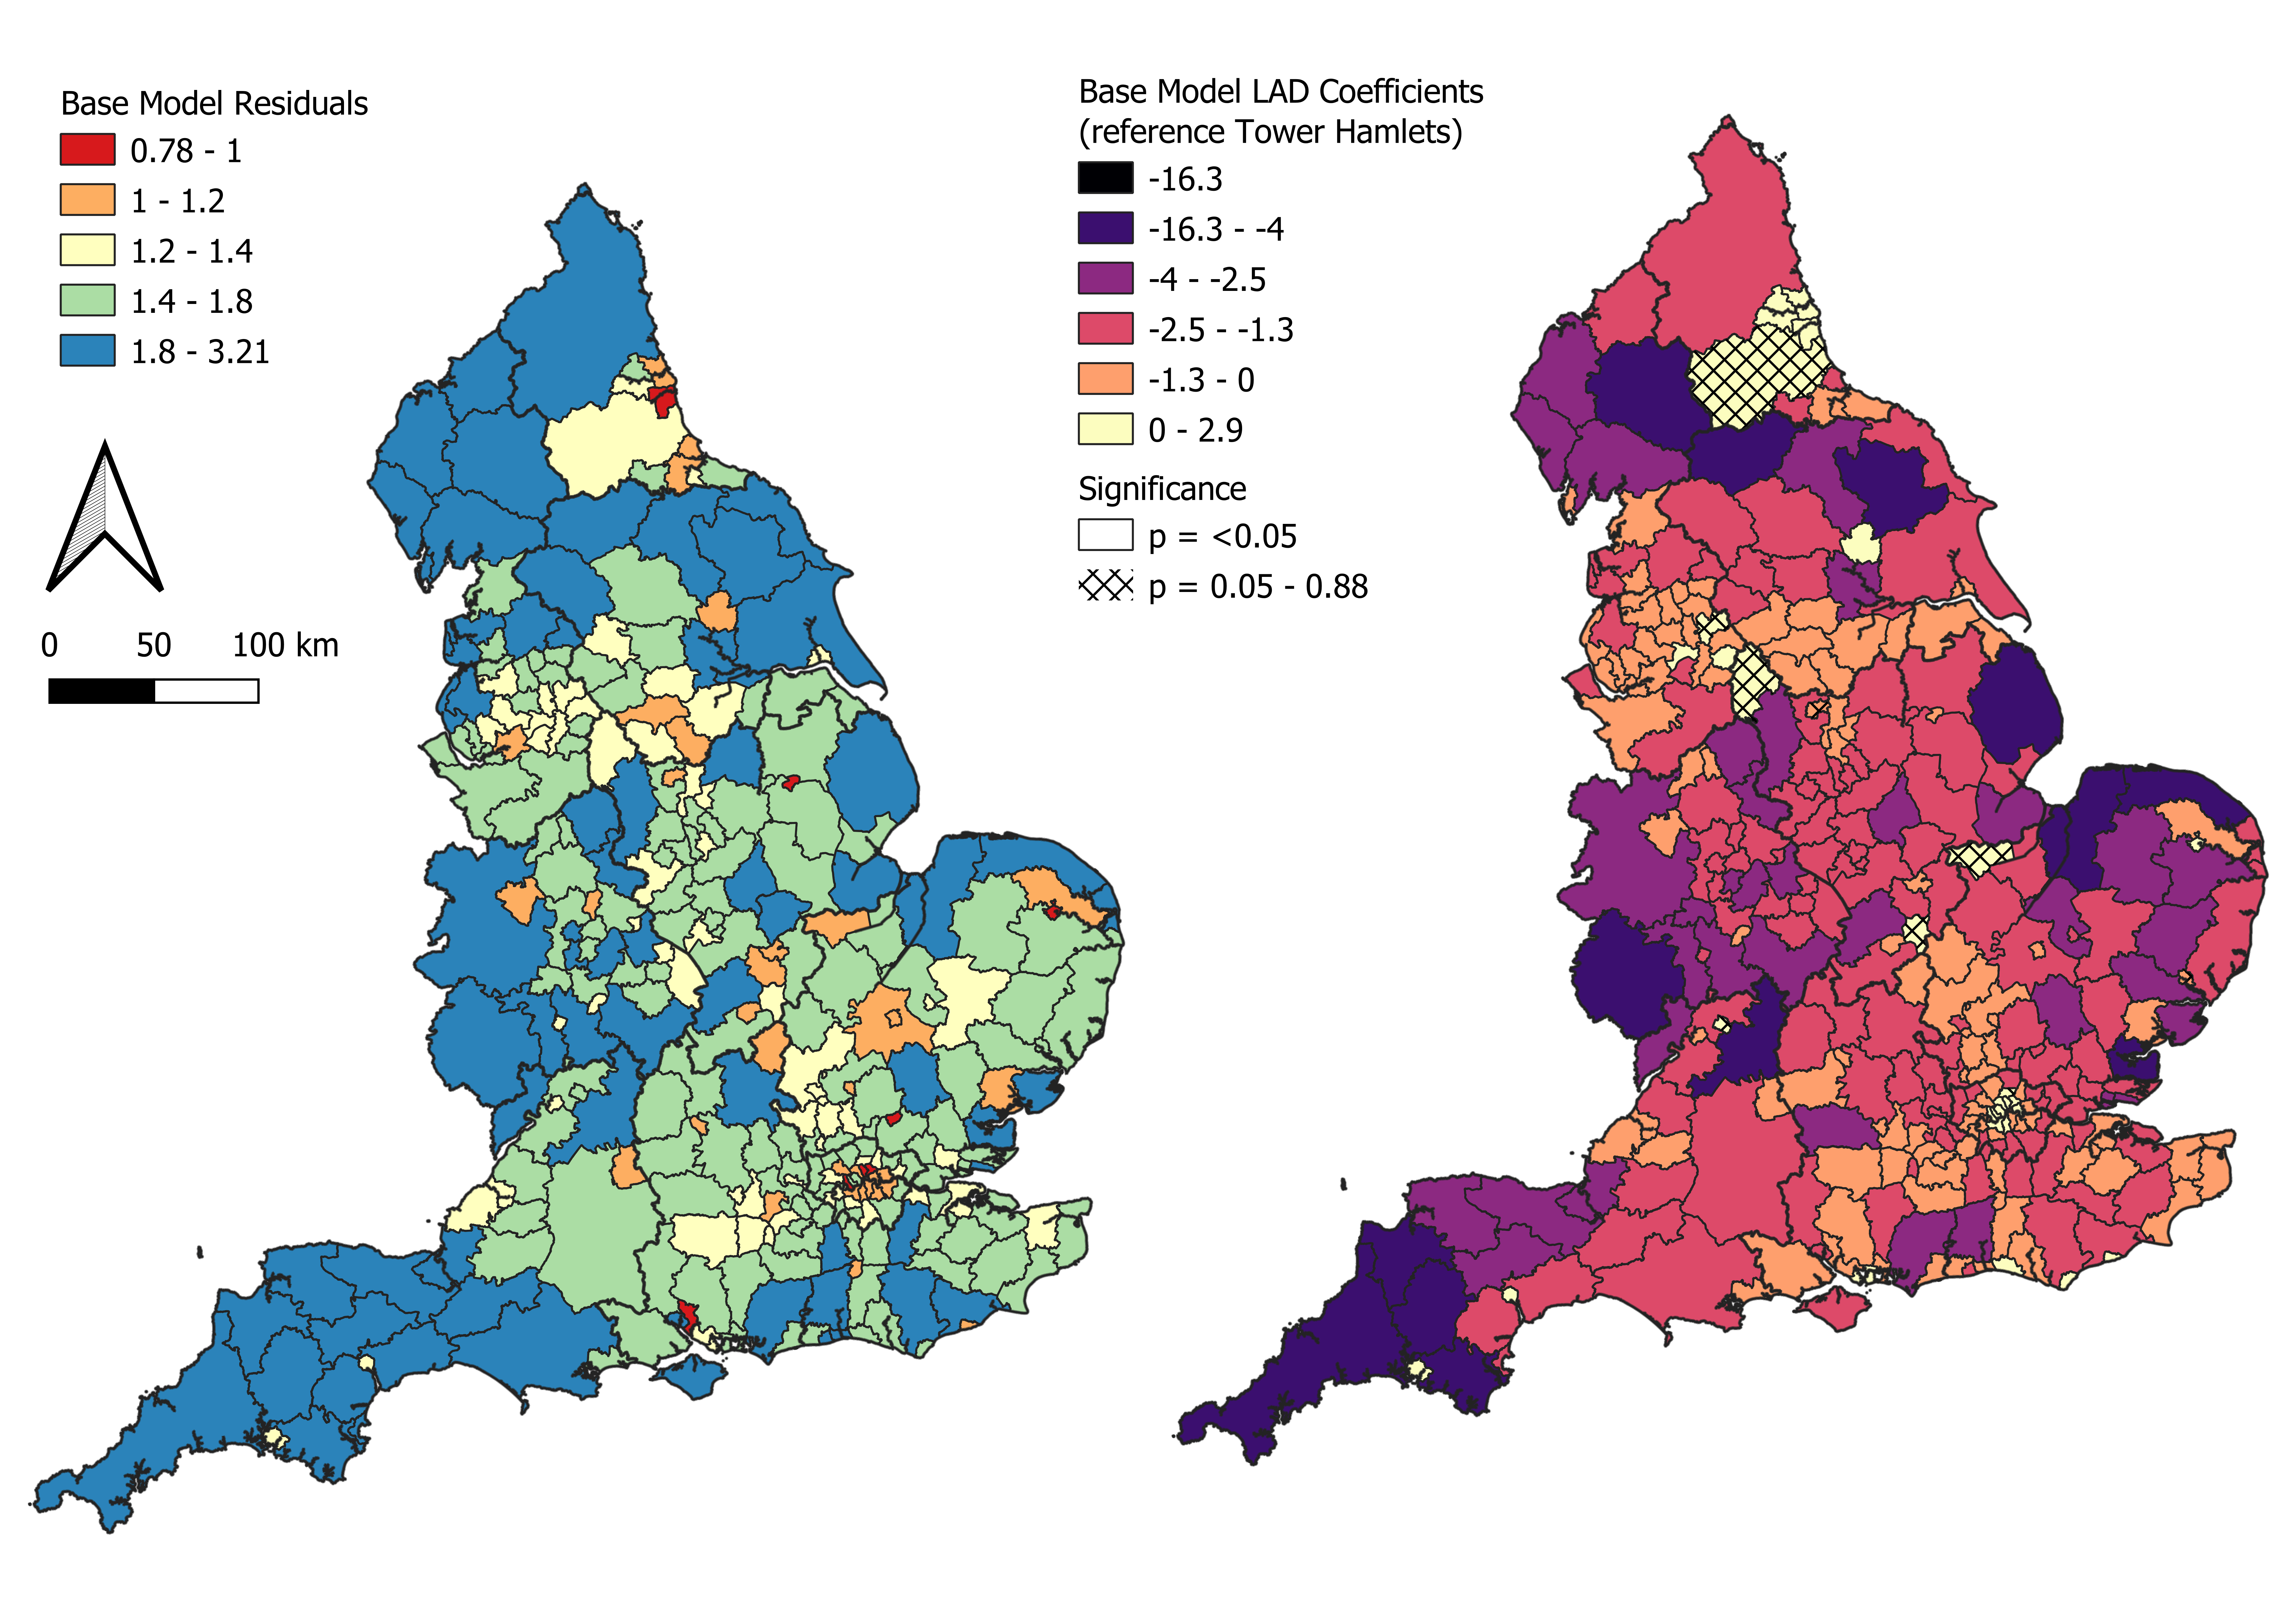
Accounting for Energy Efficiency Variations
- Local Authority location is important
- Different stock mix (more modern flats in cities, older detached properties in rural areas) key
- Map on the right:
- Expected avg EPC points (+/-) compared to Tower Hamlets (central London - best local authority) - after controlling for building characteristics
- Map on the left: residuals
- Avg EPC values are lower/worse (<1 - red) or higher/better (>1 - orange to blue) than expected, given the housing stock mix.
- Central London, in particular, Islington, Hackney and Hammersmith and Fulham performs worse than expected given the benefits afforded by stock-mix, alongside Harlow in Essex, Eastleigh in Hampshire, Norwich, Lincoln and Sunderland
- South West actually performs better than we would expect, given the stock it has
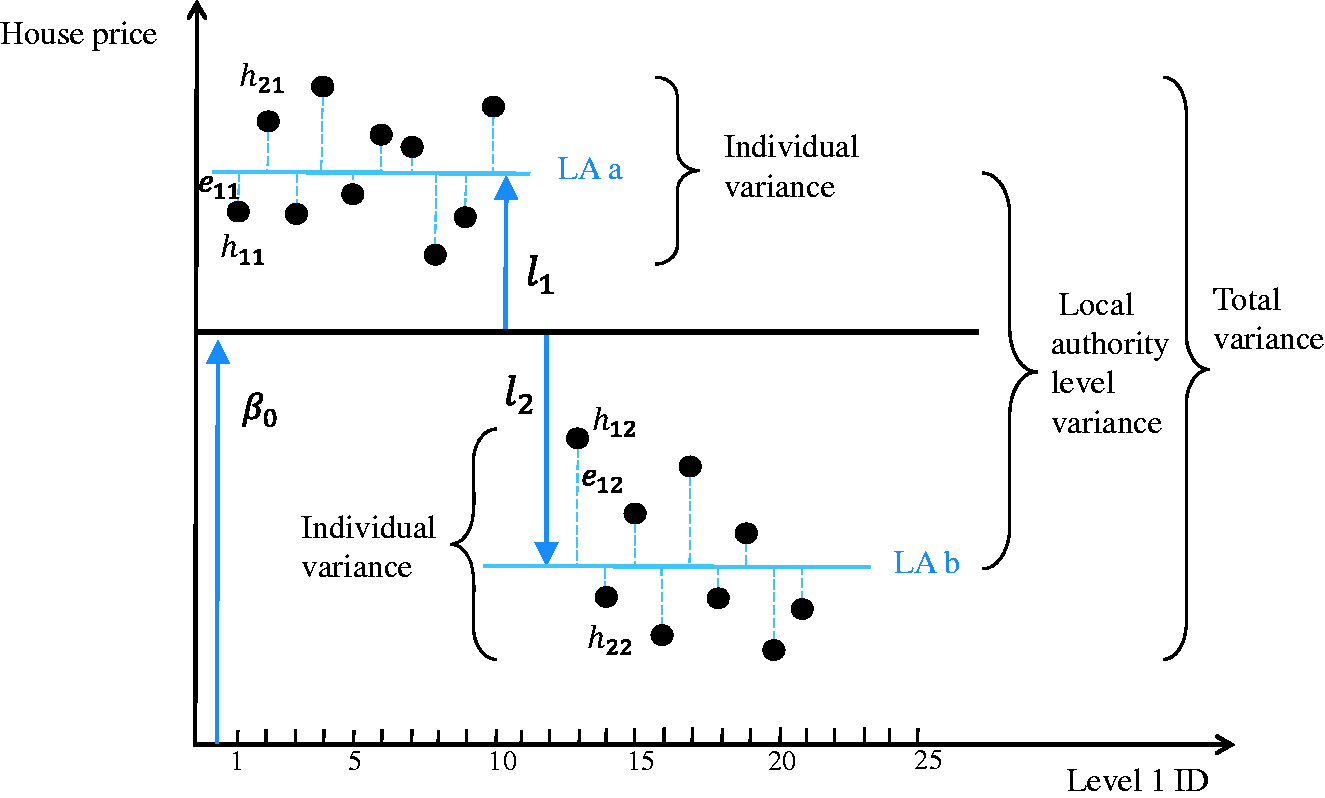
Capturing Random Variance and Spatial Hetrogeneity
Question: To what extent can variations in energy efficiency be attributed to:
property-level characteristics (size, type, etc.)?
local neighbourhood factors (relative affluence, types of resident in the area etc.)?
local government influences (much planning and housing policy is devolved to local authorities in the UK)?
Multilevel model
extends earlier model to account for similarities/differences at various spatial scales & within different groupings (neighbourhood, local authority) of properties,
while controlling for property specific variables (e.g., age, floor area, etc.).
The variance components model
baseline Multilevel model with no explanatory variables
attributes variation in energy consumption / efficiency per m2 to grouping levels in the model
What about Transport and Net-Zero?
UK government keen to decarbonise transport - 2021 Department for Transport Report:
“We cannot simply believe that zero emission cars and lorries will meet all our climate goals or solve all our problems. They will not.”
“we must increase the share of trips taken by public transport, cycling and walking. We want to make these modes the natural first choice for all who can take them”
Great start, BUT - issues of EQUITY (i.e. will everyone benefit equally and according to their needs in this transition) NOT mentioned AT ALL in the report.
![]()
Transport, Net-zero and Equity
- In the UK, transport investment justified in terms of economic benefits, journey time reductions, carbon savings etc.
- Models commissioned by government and used to support transport policy and investment in UK often narrowly focused on these outcomes
- Little attention has been paid to justifications relating to the mediating effect that transport has on social inequalities
- Danger that in the rush to decarbonise, some already disadvantaged groups may stand to lose out - e.g. those who rely on cars for work and who can’t easily shift, the rural poor, disabled or elderly
- New paper from our group exploring some of the issues ->
![]()

CASA / Arup City Modelling Lab
- Arup - large multinational engineering consultancy
- Arup City Modelling lab (CML) - group within the company - has been developing large-scale activity-based transport models based around MATSIM software for clients across the world to assist with transport planning and policy making - many recent projects around net-zero transition
- Clients including New Zealand Government, Irish Government, City authorities in the UK (Birmingham, Sheffield), Regional Authorities in UK (Transport East)
- Arup’s CML models and tooling all open source - available via github
- BUT applications are developed with, primarily, client-centred outcomes in mind
- Joint CASA/Arup initiative developed with an academic motivation to see if we can re-purpose these models to delve deeper and more critically into wider sets of equity-related outcomes


CASA / Arup City Modelling Lab
Secured funding for 3 PhD studentships starting Sept 2023 - all looking at different aspects of transport equity using activity-based models:
Claude Lynch - looking at how transport models are used in practice in the UK and how they might be used to inform policy decisions around net-zero transport in the East of England
- what are the modelling/policy/decision making dynamics and interactions between client and consultant that lead to regional transport decisions being made? How are regional transport models being used? How could they be used with respect to social equity?
Maria Wood - looking at equity issues around car dependence and the transition to electric vehicles
- what are the equity considerations around the transition from fossil-fuelled to electric private vehicles? Can we develop a better, micro-level activity-based understanding of car dependency? What mitigating or exacerbating effects might new technologies like vehicle-to-grid charging present?
Tom Murat - looking at how complex, agent-based behaviourally-orientated transport models can be used to inform decisions around the provision of public transit - particularly buses - in UK transport systems
- How might artificial intelligence methods be applied in developing generative solutions to various aspects of bus provision in different urban and regional settings?
![]()
Activity-Based Transport Models - Brief Intro
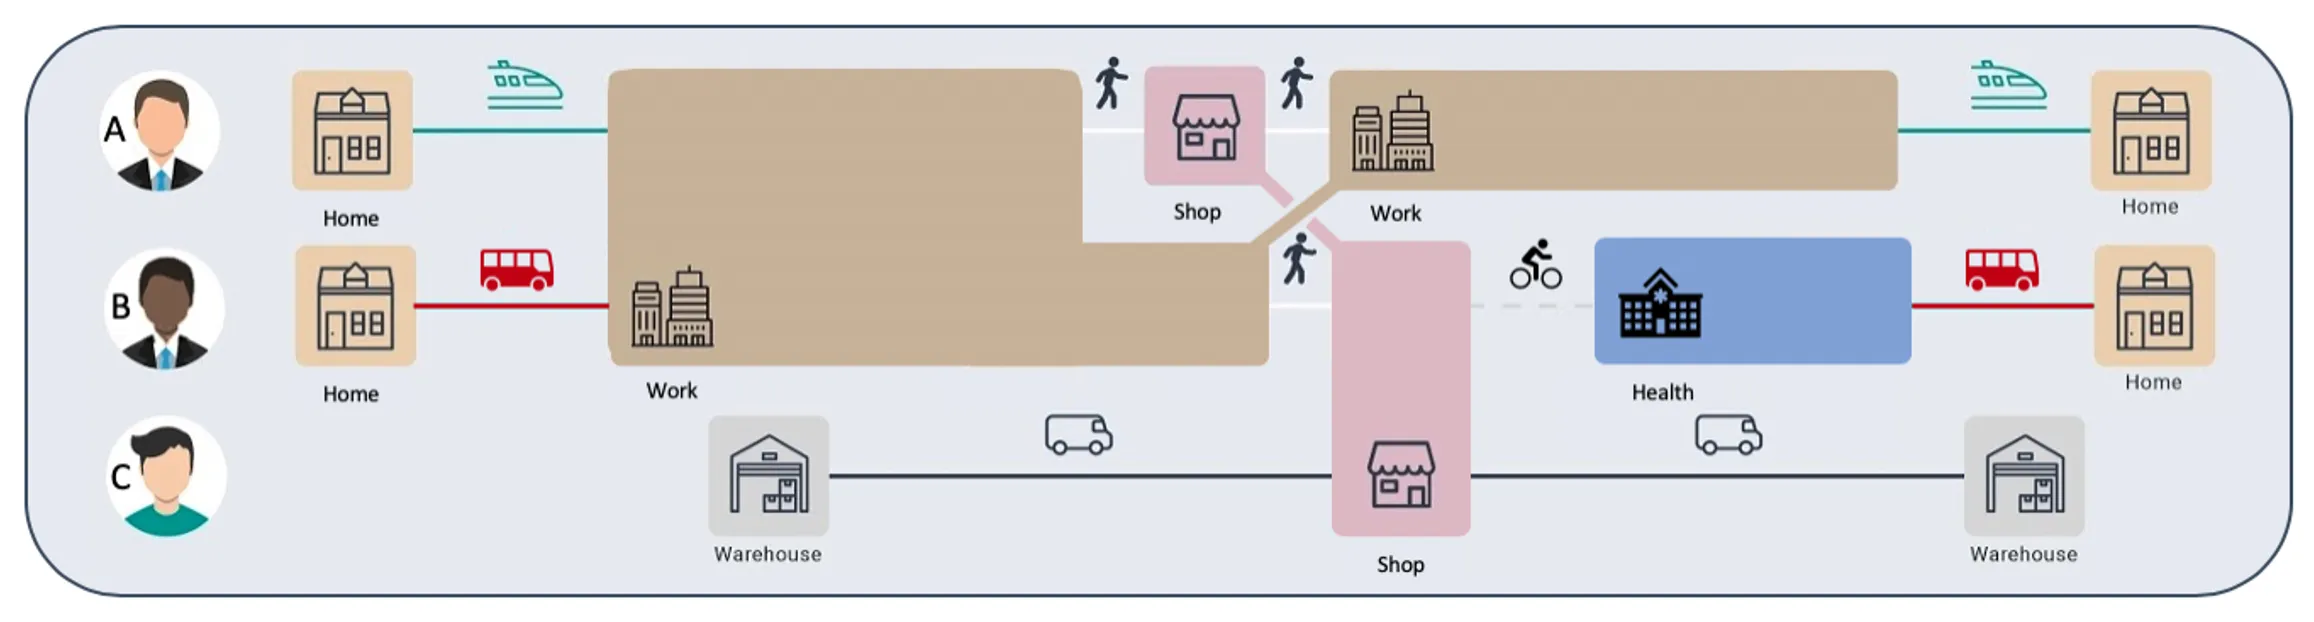
Activity-based models focus on the individual activities of (simulated) people (agents) and are able to capture the complexities of daily life, considering how people allocate time to activities throughout the day and on different days of the week
Individual decisions are based on personal attributes (age, job, wealth etc.), preferences (whether prefer to drive or cycle) and constraints (whether can afford a car, have children to take to school) etc.
Agents in the model can respond to physical and political environments - thus useful for testing different policy scenarios (road pricing, free bus travel for children etc.)
Allow for considerable granularity (spatial, temporal, agent attribute) but can be large (numbers of agents), computationally expensive, require detailed data inputs (travel diaries, road networks etc.) difficult to calibrate and not easily used by non-experts.
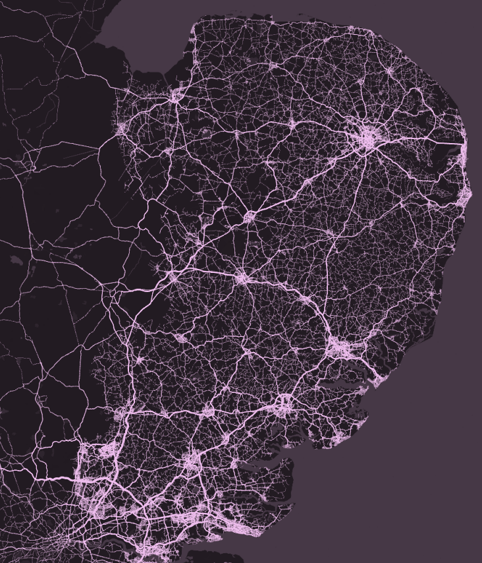
Transport East Project - decarbonising regional transport
Claude Lynch - PhD student in our group - is using activity-based model implemented using MATSIM developed by Arup for Transport East (sub-national transport body)
Simulates a 10% version of East of England population and their daily activities - 600,000 agents
Aim to evaluate transport planning interventions that help get us closer to a ‘net-zero’ transit system in the region - while examining how these might also affect socio-economic inequalities
BUT?
- How are transport models and tools like the TE MATSIM deployed in the real world (and how to they affect policy change)?
Transport East Project - decarbonising regional transport
Initial qualitative research:
- Who is using transport models in applied situations?
- What kinds of projects are they being used to simulate?
- What kind of data is being pulled out of them?
- How well is that data understood?
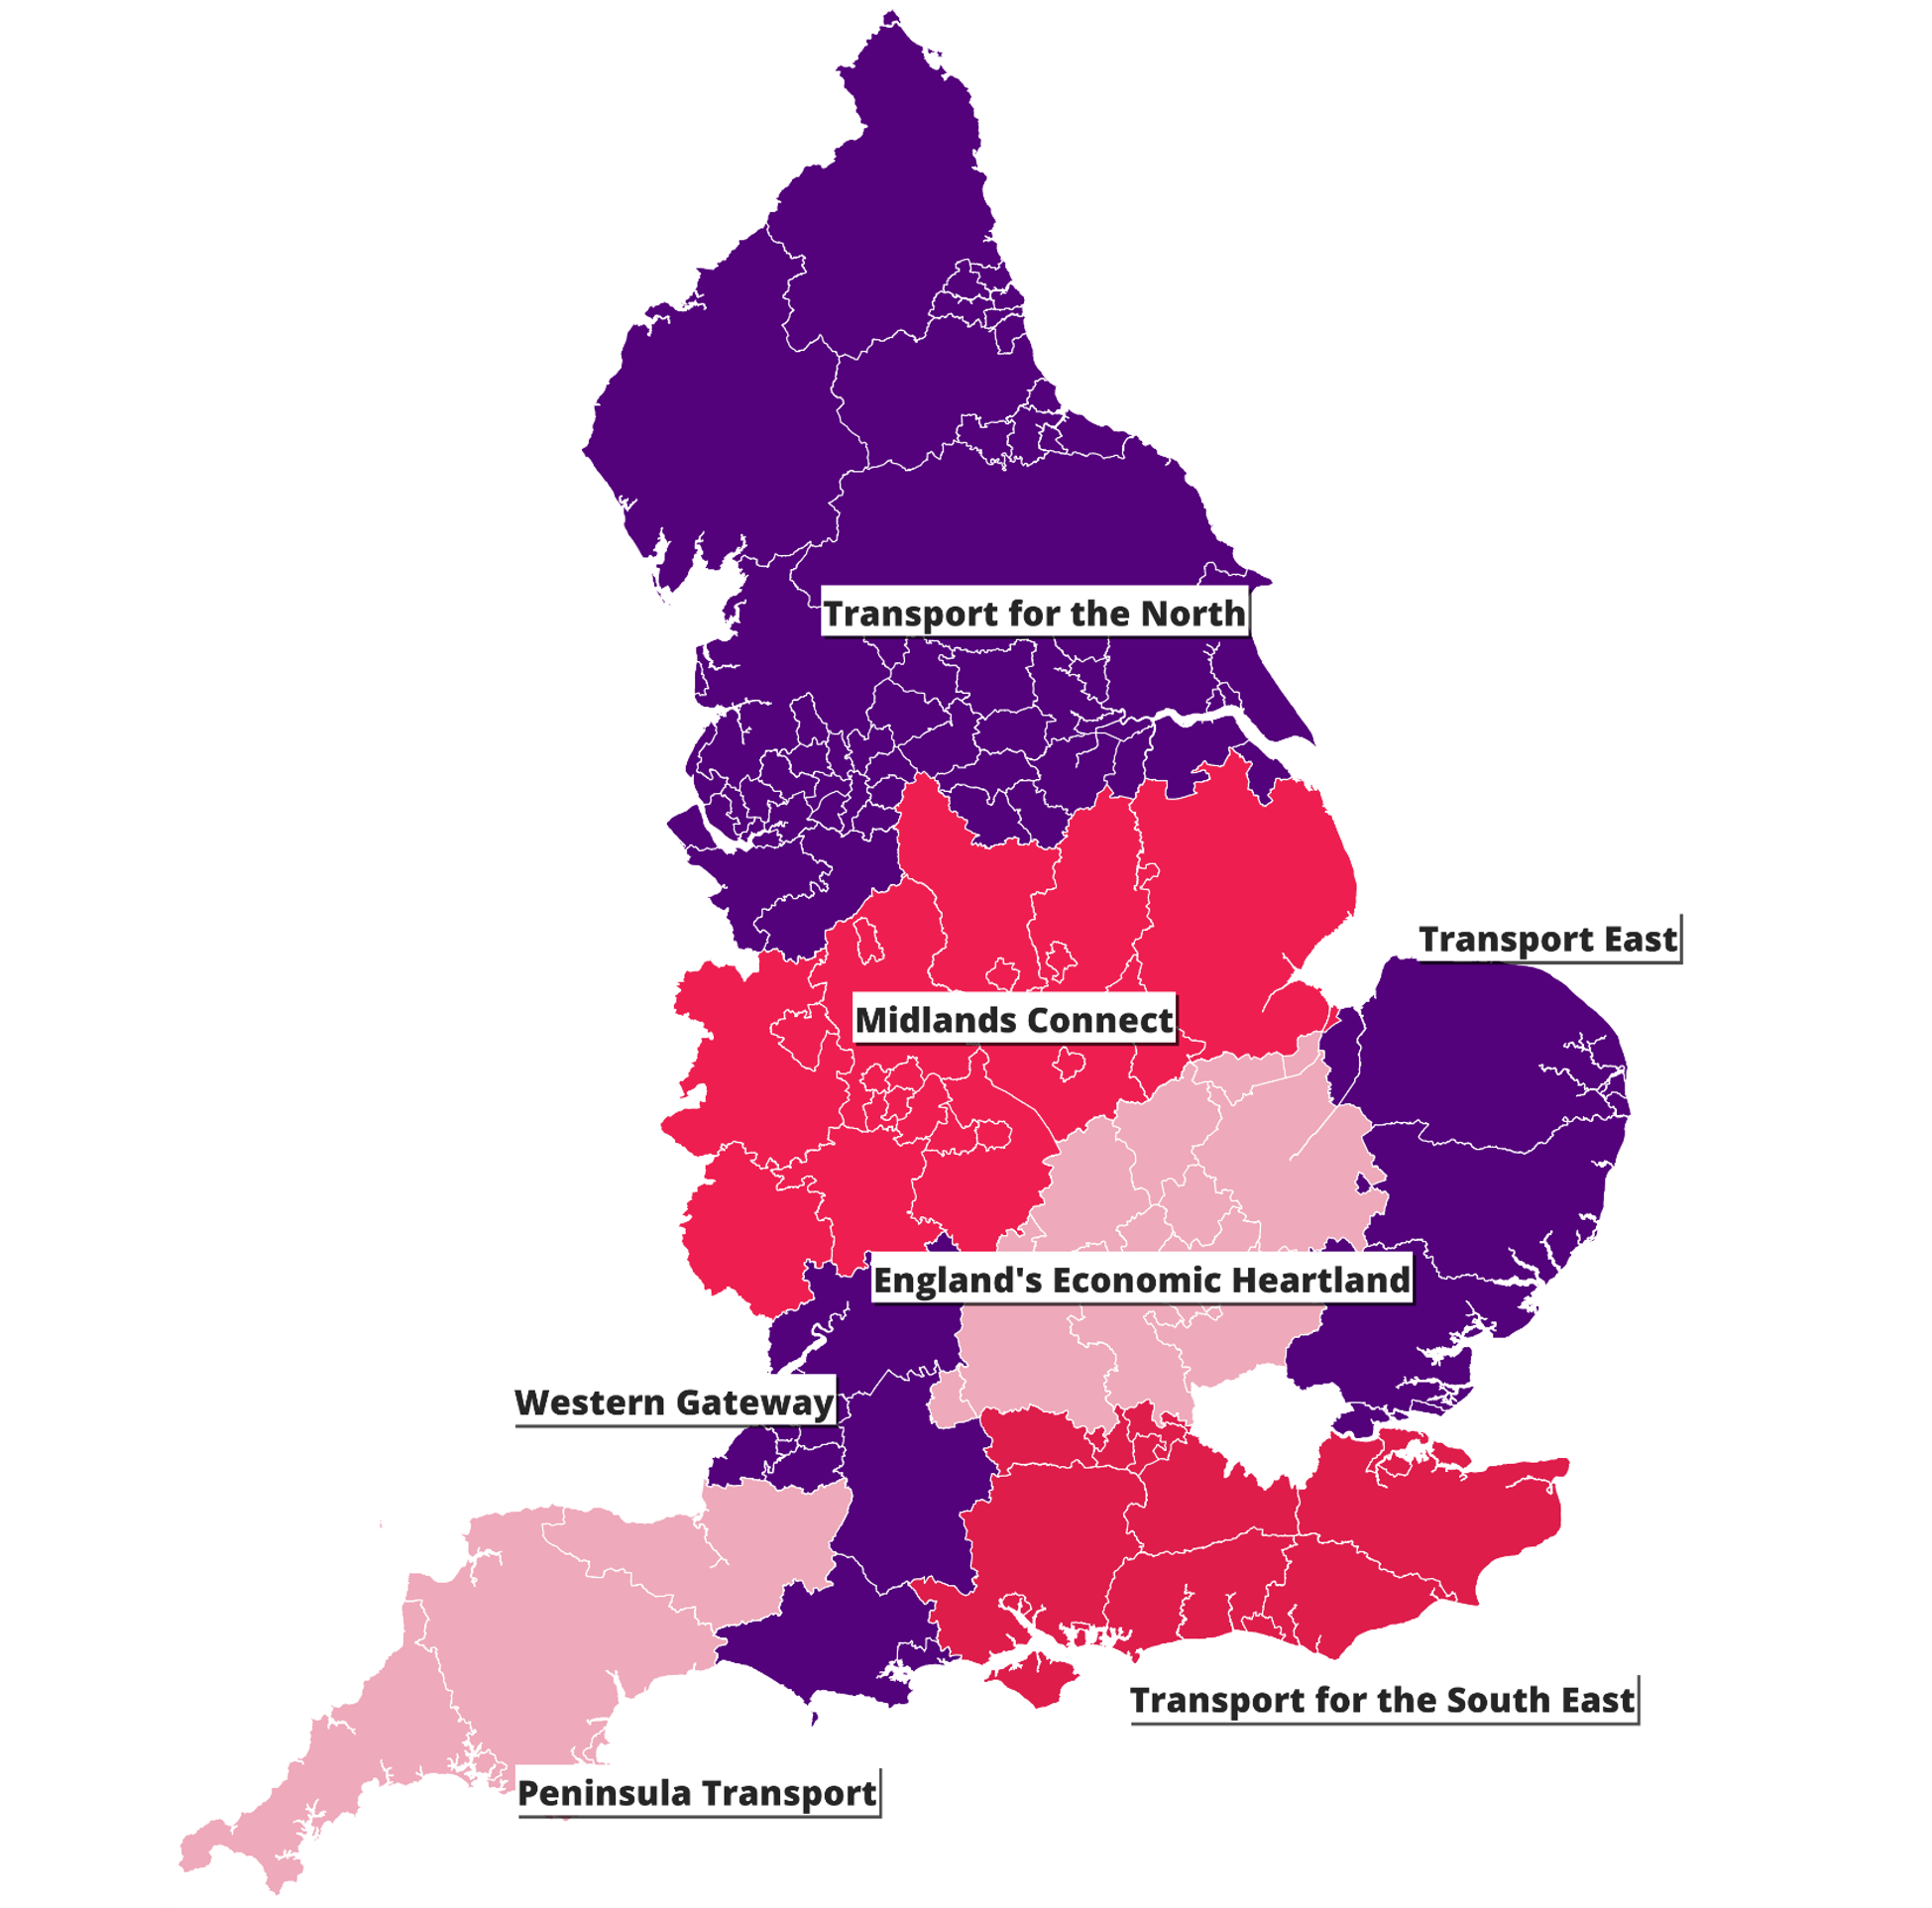
Interviewed practitioners from
7 Sub-National Transport Bodies in England,
Department for Transport and
Transport Planning Consultancies
Equity, vulnerability, and flexibility
Equity can be seen as minimising
transport vulnerability across
the whole populationWe can consider flexibility to
be a form of capital, much
like money or timeVulnerability can be seen
through the lens of
flexibility capacityMany facets of flexibility
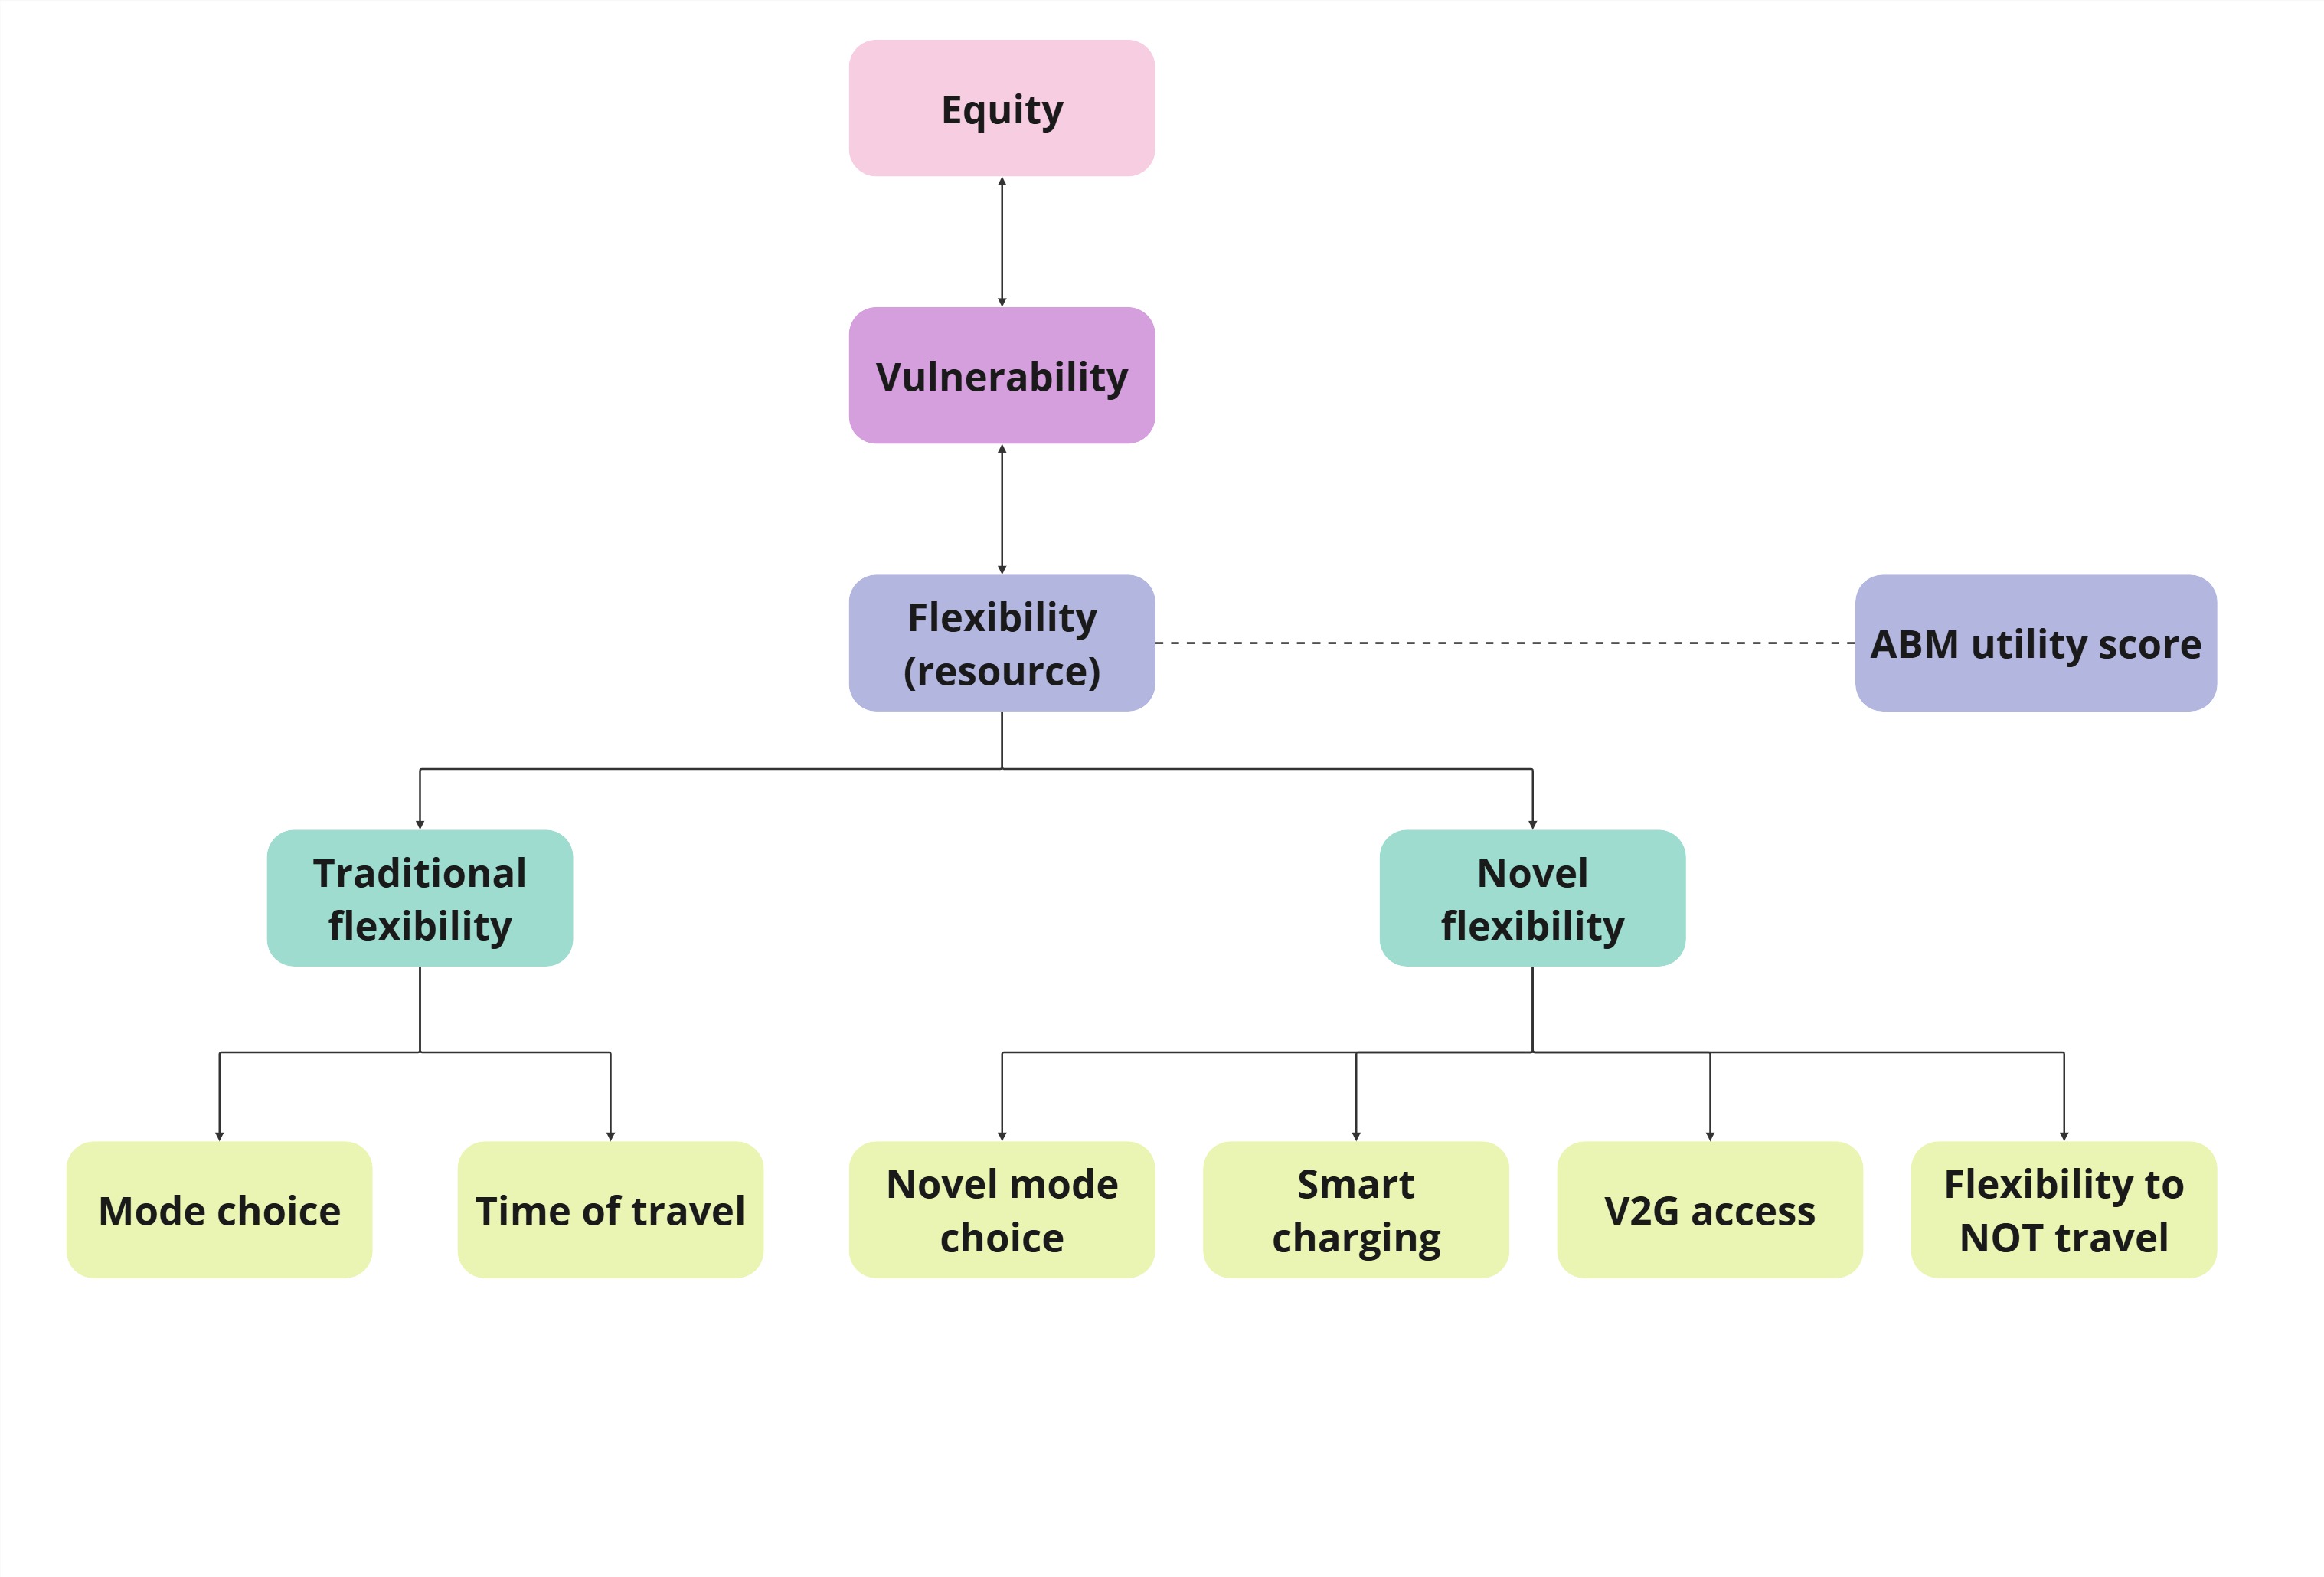
Quantitative modelling of flexibility
Lack of robust quantitative analysis of equity impacts in transport transition
Aim to inform which policies are most effective at delivering decarbonisation while maximizing equity
Use calibrated Arup MATSIM for a UK region or city (e.g. Sheffield) to understand this with flexibility capability measured as a kind of utility score
Where under different model runs and scenarios, agents select a first-choice travel preference (with associated utility score) from a range of possibilities
Can 2nd, 3rd, nth choices considered and scored be used to model flexibility capital for different socio-economic groups in the model?
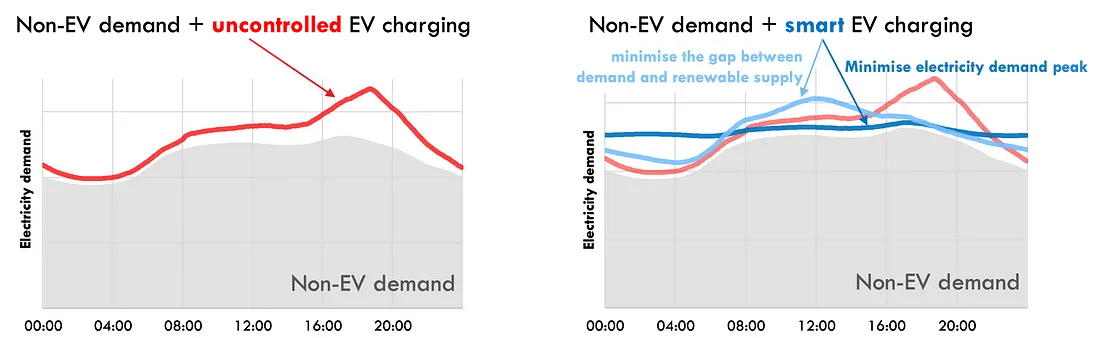
For those with lower traditional flexibility capital, what benefits might novel flexibility innovations like Vehicle-To-Grid charging bring?
Can benefits of system-wide demand peak-smoothing for electricity be shared?
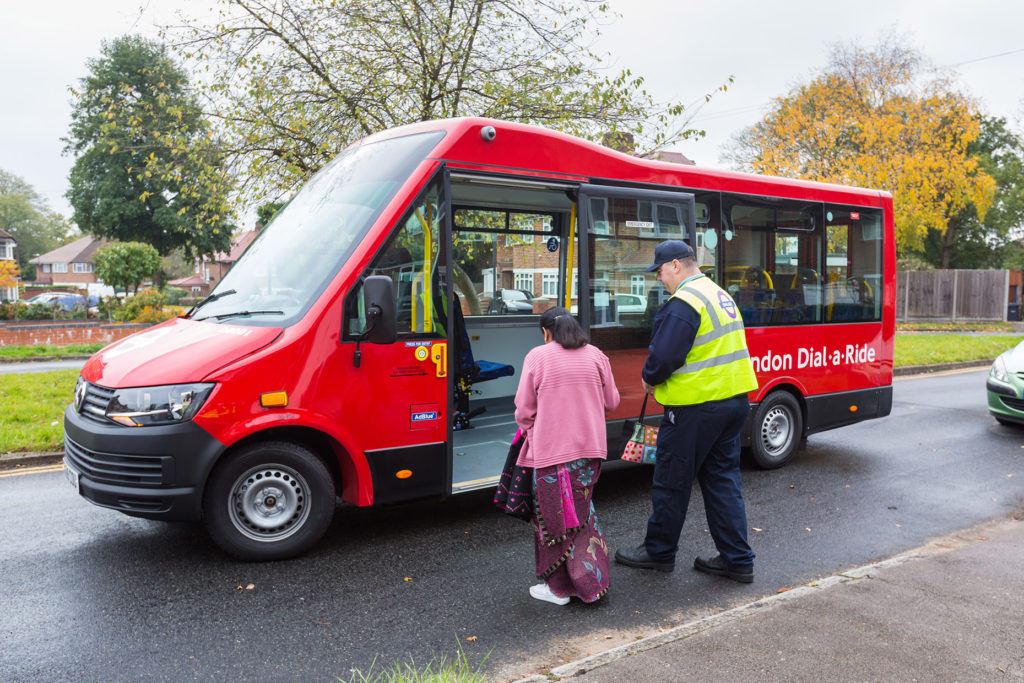
State of Buses
- Privatisation - Crash in bus ridership and route availability.
- £2 fare – Introduced to increase ridership since COVID-19.
- Bus Franchising – Devolution of transport to combined authorities - Greater Manchester (2023), West Midlands (2025), Liverpool (2026)

Toy Model Outline
Using Matsim – Agent Based Modelling
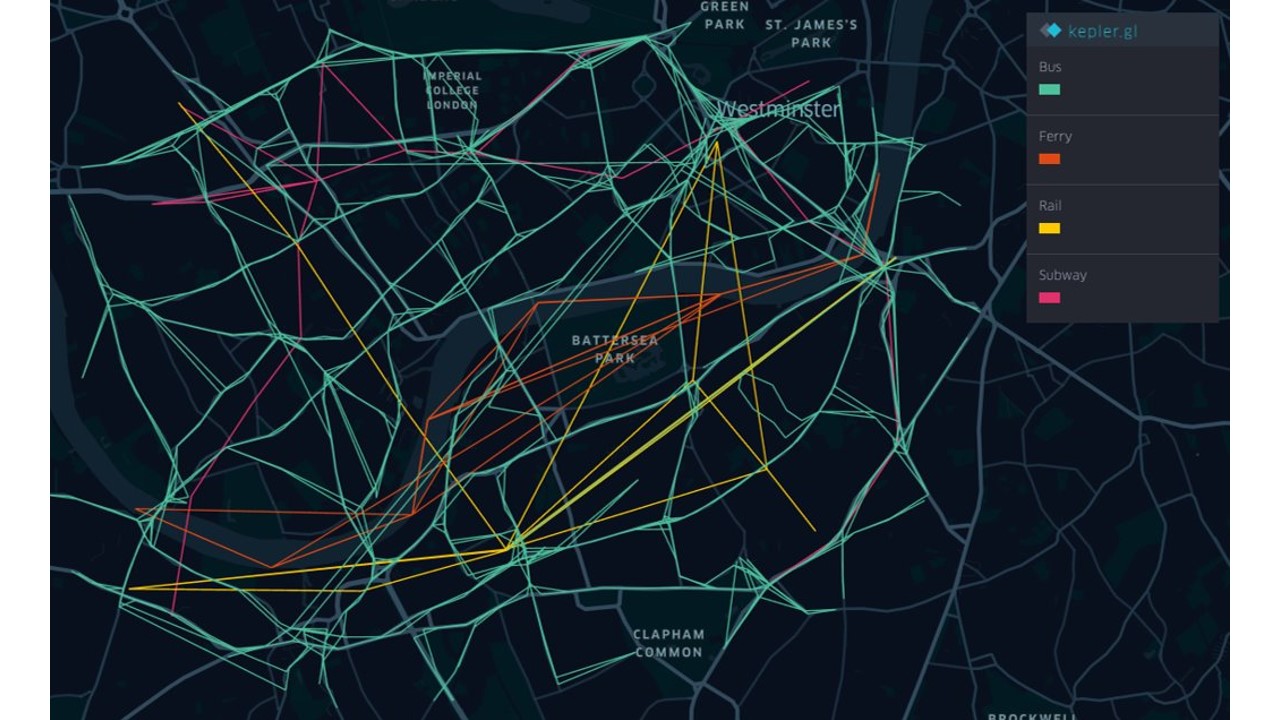
Londinium model - Semi synthetic dataset with 100 agents covering Fulham, Chelsea, Battersea and South Kensington.
- Developed by Arup, open access
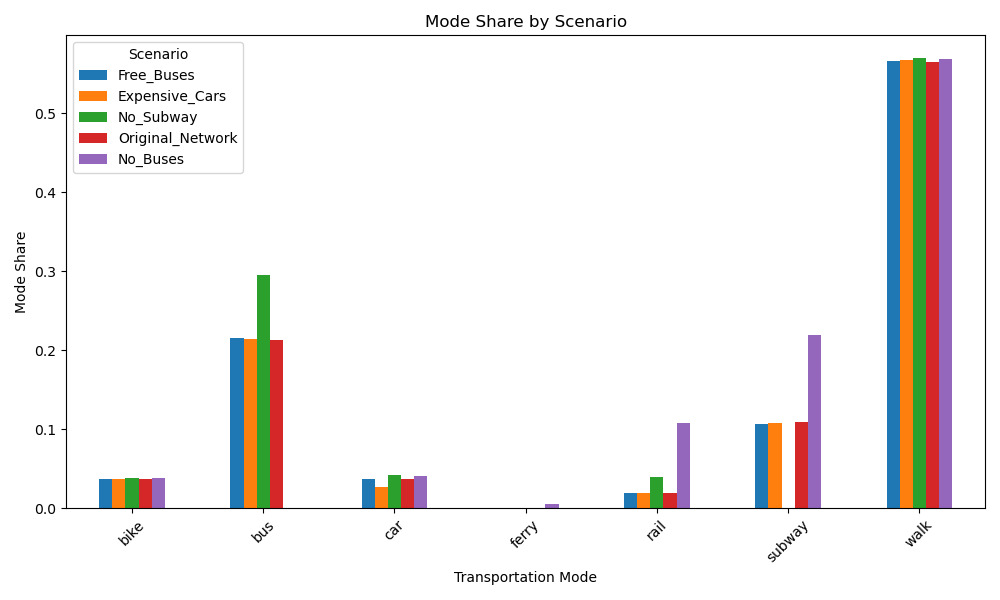
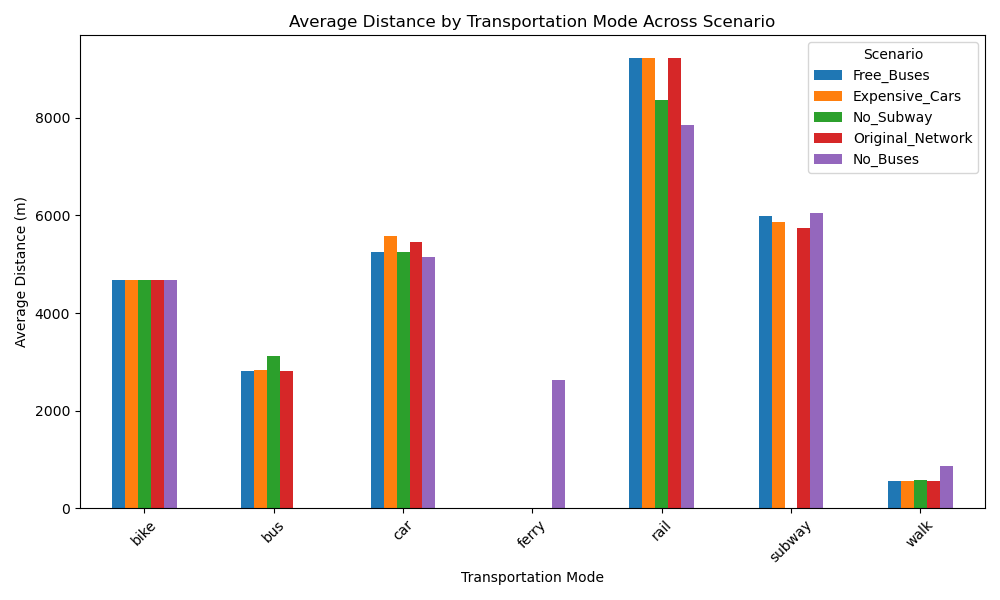
Policy Ideas Tested: Free Buses, No Buses, No Tube, Increasing Car Cost
Measures: Travel Time, Total Distance, Mode Share
Purpose: Learn the model, what’s possible and what’s not
Model Results - Mode Share
Model Results - Average Distance
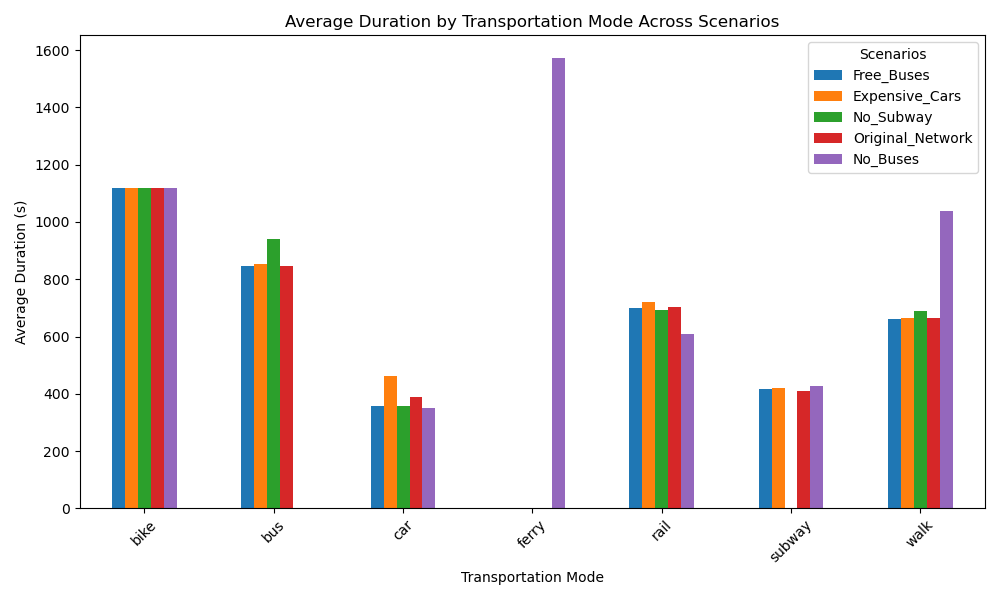
Model Results - Average Duration
Going Forward
Implement lessons learnt into a calibrated Sheffield model.
Demand Responsive Transport – Flexible transport options
Implementation of AI:
Bus scheduling (Ai, G. et al. (2022))
Express Bus Routes (Rodriguez J. et al. (2022))
Network Changes
Equity Measures - Can we develop metrics outside of
traditional transport metrics (Mode Share, Travel Time)
to measure equity?

Overall Observations and Conclusions
- All countries are grappling with how to transition various sectors to low-carbon in order to meet internationally agreed targets
- In the UK housing and transport are two of the biggest challenges but both have important social dimensions which need addressing
- in order to both affect the transition and target improvements more effectively (in the case of housing)
- and to ensure that the transition is equitable and fair (in the case of transport)
- Urban models can play a part in building an evidence base for policy and decision making in these areas
- But, challenges of capacity and scope persist at the level of policy and decision making, so as academics we need to be vocal in advocating for attention to be paid to the social dimensions of these transitions
![]()